a blog where students of Licence Frontières du Vivant undergraduate program (University Paris Descartes) post about the research they are conducting as part of the learning through research courses I teach
Week 2 of Biosensors course focused on examining how biological and electronic systems perceive forces in their environment.
Students designed their projects in a way to try to compare specific characteristics of both biological and electronic sensor, by carefully designing the experimental setup, choosing the appropriate biological model organism as well as the creation of the electronic device.
Hi there ! We are students from the “Frontiers of Life” bachelor, created and hosted by the Centre of Research and Interdisciplinarity ! The Biosensors seminary has slowly come to an end, and the project we worked on and are about to present, is the last one out of 4.
For those who do not know what the Biosensors are and missed our first blog posts, it’s an interdisciplinary seminar during which we develop and design in small groups several one-week scientific research-projects connected to each other by various notions such as light, forces and chemical gradients.
The aim of these projects is to observe and compare biological (plants, bacteria, insects, vertebrate, human ….) and electronic sensors (light, movement, conductivity, temperature sensors…).
This week, the comparison wasn't necessary, and we were free to develop any project, as long as it involved sensing (biological or electrical).
For our last project, we decided to study one of the most fascinating phenomena in the plant kingdom : thigmonasty. Thigmonasty consists in the response of a plant to touch or vibrations. Mimosa pudica appears in scientific literature as a common example capable of responding to various stimuli (rain drops, wind …)
We got inspired by a project that had been conducted by former FDV students in 2013, named “Electrical response of Mimosa pudica to an external stimulus”. Mimosa pudicais a herb that has leaves that fold inward when touched. The project consisted in comparing the voltage response of Mimosa pudica (in terms of electrical potential) according to the nature of the stimulus. They could observe that the response differs whether the stimulus was mechanical or electronic.
After more bibliographic research, we realised that water was the basis of the thigmonastic reaction.
Indeed, the thigmonastic movement is produced by the main pulvinus (sort of articular surface from a plant) at the base of the petiole (stalk that attaches the leaf to the stem) and «results from the explosive loss of water from specific cells in the pulvini, causing the cells temporarily to collapse and inducing very quick curvature in the organ where they are located»
Combining these informations, we asked ourselves this question:
Do different water conditions impact Mimosa pudica’s electric response to a stimulus?
According to previous studies, the efflux of potassium ions (chemicals that own an electrical charge) from the pulvinar cells of Mimosa Pudica was shown to increase substantially during the seismonastic reaction, generating an electric current which can be measured by means of a voltmeter or an oscilloscope.
We supposed that the plant’s cells watered with different amounts of water would release various volumes of electrolytes (ie. fluids carrying electric charges), and thus that we could measure a variation in the electric response of the plants according to the humidity of the earth the mimosa growing in.
What did we compare?
To answer this question, we used 9 Mimosa that grew in the same conditions. We divided them into 3 different humidity conditions, planning to take 3 measures (repetitions) per plant:
3 of them were dried using a dehumidificator (“dry”)
3 of them were left as they were (“normal”)
3 of them were watered with 20 cL of water (“wet”)
One of us was then chosen to touch each plant so as to minimize the variation in “force” used.
What did we measure?
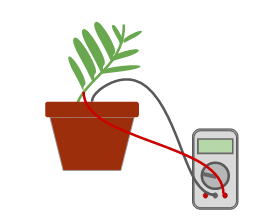
We then had to acquire our data. We placed 2 electrodes on our Mimosa, one in its soil as a reference and one on the node of the branch stimulated.
After that, we connected it to a voltmeter and tested our protocol. That was when we encountered our first difficulty: the electrode would detach each time the plant was stimulated! We thought about other types of electrodes, but they would've broken our stems and we didn't want to hurt our Mimosa. We were quite stumped.
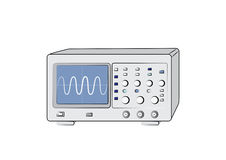
That is when we had an idea: why not use an oscilloscope! The oscilloscope’s electrodes are easy to place and with their hook-like shape wouldn't fall of!
We found our physics teacher and asked him if he could lend us an oscilloscope and its electrodes. He did more than that! He showed us many types of electrodes, helping us choose the most adapted, and helped us install the oscilloscope, showing us how to set it up, how to acquire the data directly on a USB key (instead of filming the screen and try to transform it into data) and testing its usefulness on Mimosa with us.
Thanks to this new tool we were able to design our final precise protocol that we will use to acquire data. So we repeated a simple experience for all the conditions that we described above. Indeed we created a mechanical stimulus during an electrical tension acquisition with the oscilloscope to observe the response on the drawn graph.
We knew that amplitude of the signal after the stimulus and the time it takes to go back to “normal” (return time) were two good indicators to quantify the response. So, as you might expect it, we measured both for each of our 27 graphs.
What are our results?
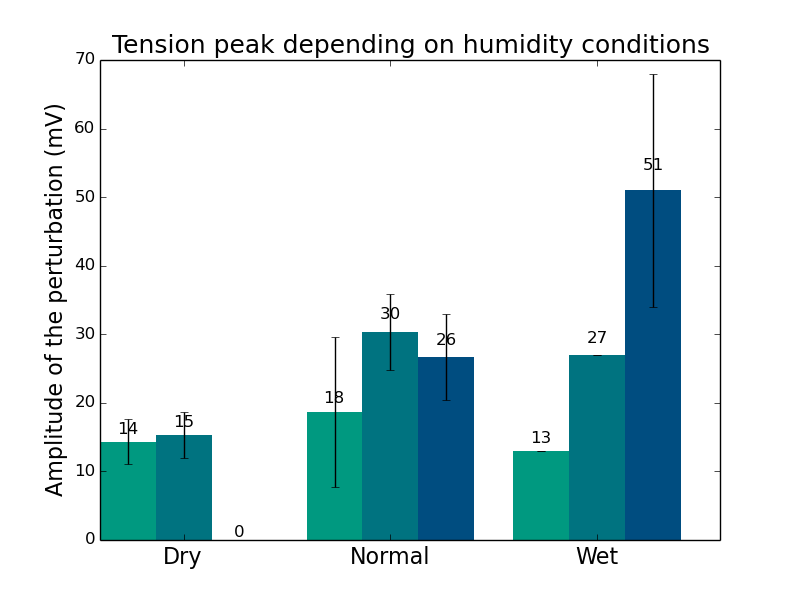
Then, we decided to plot the averages values per plant (repetitions) as one bar but the different plants (replicates) separately. Thus we obtained those two graphs (the first one represents the amplitude of the signal’s peak and the second one the return time, both depending on water conditions).
In both case, we seem to see an increase of both the amplitude of the perturbation and the return time as we expected. This finding would mean that water would have a direct impact on the electric response of the plant.
But this trend, is not measurable. Indeed we have been constrained to name the conditions “arbitrary” because our soil humidity sensor appeared to be unworking.
Anyway, we have also notices that in each case, the return time and the amplitude of the peak are directly correlated. Indeed we can see exactly the same relative differences between all the replicates on the two graphs.
Finally, this project was for us a chance to develop our background knowledge on a particular subject and to train our project leading skills. Hopefully, it might brings you [readers] something on one of this two aspects of research!
Curious? Interested? Want to know more? Have a look at the links :
Want to read scientific articles about Mimosa pudica and its thigmonastic reaction? Have a look hereor there!
If you want more information, but easier to understand than scientific articles, you might prefer reading this, that and what about this instead!
Or maybe you want to grow out your own Mimosa pudica? You can find information here!
How does heat shock impact the yeast cycle of life?
How does this fascinating question came in our mind?
For the final project of the Biosensors month, we decided to focus on…
thermal shock !
In microbiology field, thermal shocks are mainly used for DNA cloning. Cloning is a major technique used in microbiology and molecular biology in order to artificially or naturally multiply DNA, usually a gene, thanks to a micro-organism. It allows a higher expression of these genes useful to protein production. Process includes an alternation of cold and hot temperatures applied on microorganisms culture, as you can see on this video, that compare heat shock and a chemical process. Alteration allows the introduction of a gene inside the cell pursuing cellular division. The gene of interest is therefore transmitted to next generations.
But how does this technique allow the insertion, what happens inside the membrane? It is simple enough: heat fluidifies the proteins and phospholipids presents in the membrane. But shocks can disturb the membrane if the temperature is too high because proteins are denatured i.e they are not functional anymore and phospholipids are disorganized. So a well-balanced temperature has to be choose for the DNA cloning.
Now you know how heat shock works and probably better understand why we wanted to study heat shock effects over micro-organisms membranes for our last week project.
Figure 1: Here is a small sketch of what you need to know basically on microbiology.
But… How did we answer that question? A beautiful story about yeast and dye
Which cobaye? Baker’s yeast Saccharomyces cerevisiae, a model organism commonly used in biology!
Figure 2: Observation with the microscope of Saccharomyces cerevisiae.
Yeast tolerates temperature between 0 to 55°C but it is a temperature dependant organism and we thought it would therefore be more sensitive to high temperatures. Doing bibliography we found that 50°C was the ideal temperature for shocking yeasts but we then had to figure a way to observe shock impact.
How? a red dye named Phloxine B!
Living yeasts pump out the dye when they are metabolically active (alive) but stay red tinted when they die. We were now able to count the dead cells after the shock and to compare lifespans at ambient and hot temperatures!
Fig. 3: We used S. cerevisiae culture to observe yeast growth and shock them. Growth curve observation is meant to indicate first the right moment to start experiments then the impact of these experiments on yeasts.
Fig. 4: example of growth curve representative of yeasts concentration. Exponential phase is the time when cells divide rapidly so their membranes are flexible therefore the ideal moment to perform our experiments!
What we finally obtain… Not expected but still a beginning:
Fig. 5: yeasts we have seen under the microscope.
We observed yeasts under the microscope and saw that after 50°C shock, yeasts had a red halo. Our hypothesis about this phenomena is that heat allows the phloxine B to go into cells easier because yeasts first use its energy to keep their membranes functional, not explode then to expulse the phloxine B. But only boiled yeast (80°C heat shock) were totally red, this is the positive control, which allow us to verify phloxine B action on dead yeasts.
Fig. 6: positive control i.e experiment whom result is known and prove
that protocol is suitable
Our conclusion on this amazing experiment:
Running out of time, we were not able to continue the growth observation and see heat shocks affect over time. Even if cells began to stay red which allowed us to suppose that heat shock effectively reduces yeasts lifespan, we also can not conclude about long term effect.
You may ask what comes next? Well, doing these experiments again!
During this week, we faced some difficulties and finished running after some more time but we all agreed that if we had to try we would keep the protocol but use a different yeast strain: one that kindly accepts to actually grow!
If you want to discover how cool organisms are yeasts, just go here!
We do not have cool pictures to show you but here you can learn how to create fluorescein, Phloxine B cousin dye! Just remember that phloxine does not need fluorescent filter to be seen
The content created by the Learning thru research Student Bloggers and those providing comments are theirs alone, and do not reflect the opinions of Centre de recherche interdisciplinaire, University Paris Descartes or any employee thereof. The authors of posts and comments are responsible for the accuracy of any of the information supplied on this blog, as well as for any content copyright issues.


