Showing posts with label #arduino. Show all posts

February 14, 2017

Phycomyces blakesleeanus’ everyday fight: Gravitropism VS Phototropism

Phycomyces blakesleeanus’ everyday fight:
Gravitropism VS Phototropism
By Lara Narbona, Elena Calamand, Tanguy Chotel


Phycomyces blakesleeanus is a fungus (mushroom) sensible to light, gravity and way more things like touch and wind. For example, when it senses a nearby object, P. blakesleeanus will change its growth direction as well as its speed in order to avoid it.
 
In this project, we decided to focus on its reaction to light and gravity, also known as phototropism and gravitropism. Phototropism can be defined as the ability of an organism to develop towards light while gravitropism as its ability to develop according to gravity. In the case of P. blakesleeanus, it does positive phototropism and negative gravitropism, meaning that it develops towards light but against gravity.

The exact purpose of the project was to find a threshold from which phototropism would have more impact to Phycomyces than gravitropism. So, from which intensity of red light, Phycomyces would mostly grow towards the light than against gravity. We chose red light because we found that blue enhances geotropism

But why ? why would this fungus be attracted to light and not grow in the opposite direction of gravity ? Well from what we found and read, the "sporangiophores", the sexual parts of this organism needs to leave the ground and reach the surface to spread it's spores. In order to reach the surface, it must follow the light AND go in the opposite direction of gravity. This seems to be the most plausible explanation that we found for this mechanism.

Protocol

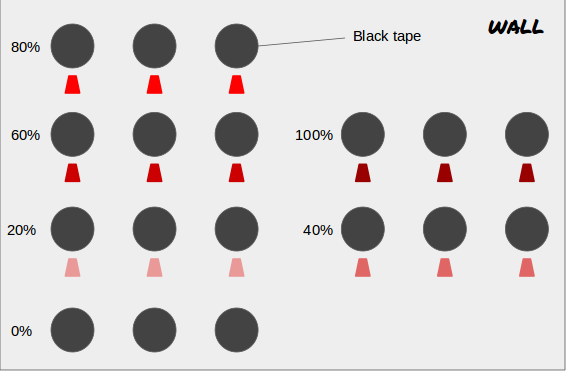
To test it, we made our fungi grow on different petri dishes, boxes commonly used in microbiology to grow organisms in controlled environments. We attached them to the wall and put different intensities of LED above them: gravity would make them grow up and LEDs grow down. Different intensities were 20%, 40%, 60% and 80% of total LED intensity. To be sure that they were isolated from other lights except from the LEDs, we put opaque tape all around petri dishes and LEDs and pierced it to let oxygen go inside.

To be sure that light and gravity actually had an impact on the growth of our organisms, we did what we call a ‘control’: one for the maximal exposition to the condition and another for the minimal. And you can wonder: on what does that help? It actually gives us two extreme organism responses: the one with no light (we expect no-response) and the one with 100% light (we expect the organism being completely attracted by it). From this two responses we will know if our organism reacts to the condition we are changing (what we expect will happen) or not (both controls will grow similarly). To do the controls of gravity, we put the plates vertically on the wall (we expect the fungi to grow up) and horizontally on the table (we expect them not to have a priority of growing up or down).


Results

After 2 days, we took pictures of the growth of our organism. Because we taped almost-hermetically the petri dishes, we feared that our organisms wouldn’t have enough oxygen to grow properly. Also, we didn’t let the organisms grow for enough time to develop their reproductive parts (what is actually sensible to gravity and light).
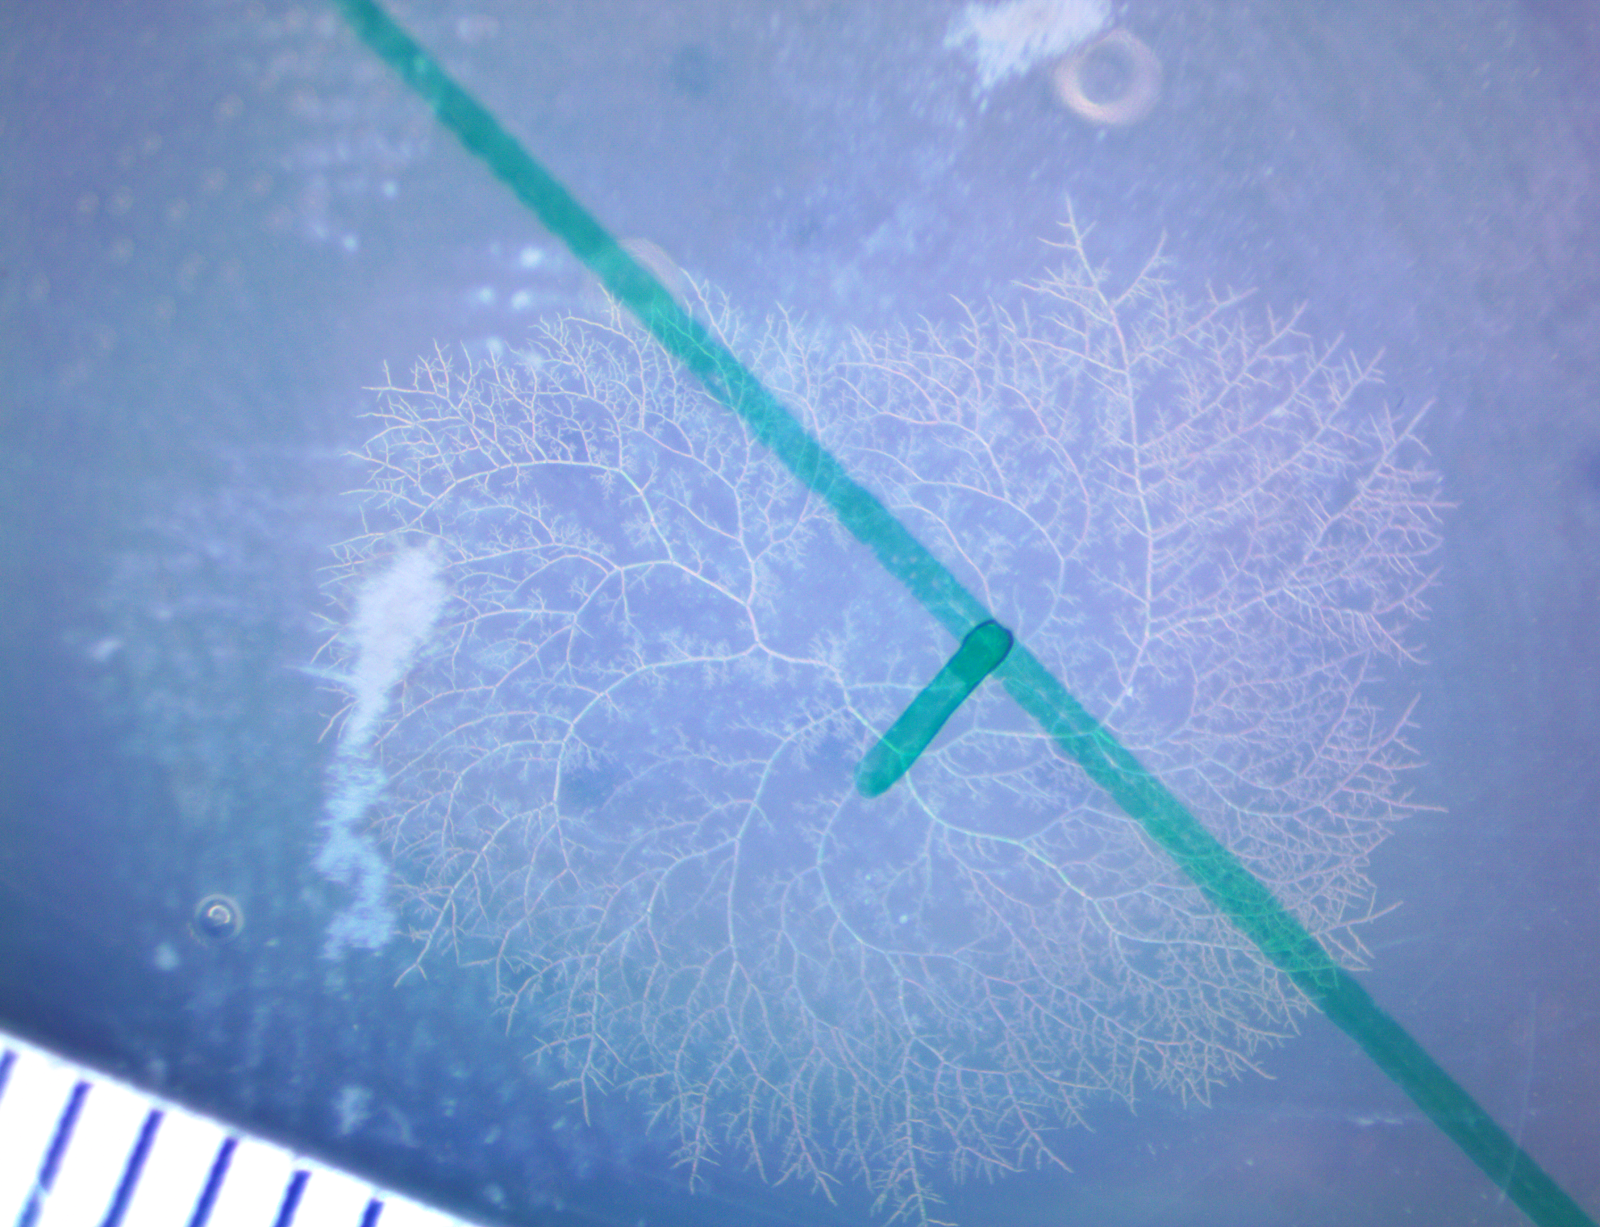
Defying our expectations we were glad to discover that many of the boxes contained beautifully grown fungi, as you can see:
0.png 

To compare how many of the fungus had grown towards the light and how many against gravity, we drew a parallel-to-the-floor line. We supposed that what had grown under the line would have been attracted by light and what had grown over the line would have been attracted by gravity.

From this, we decided to do two different approaches to analyse the growing of our fungus:

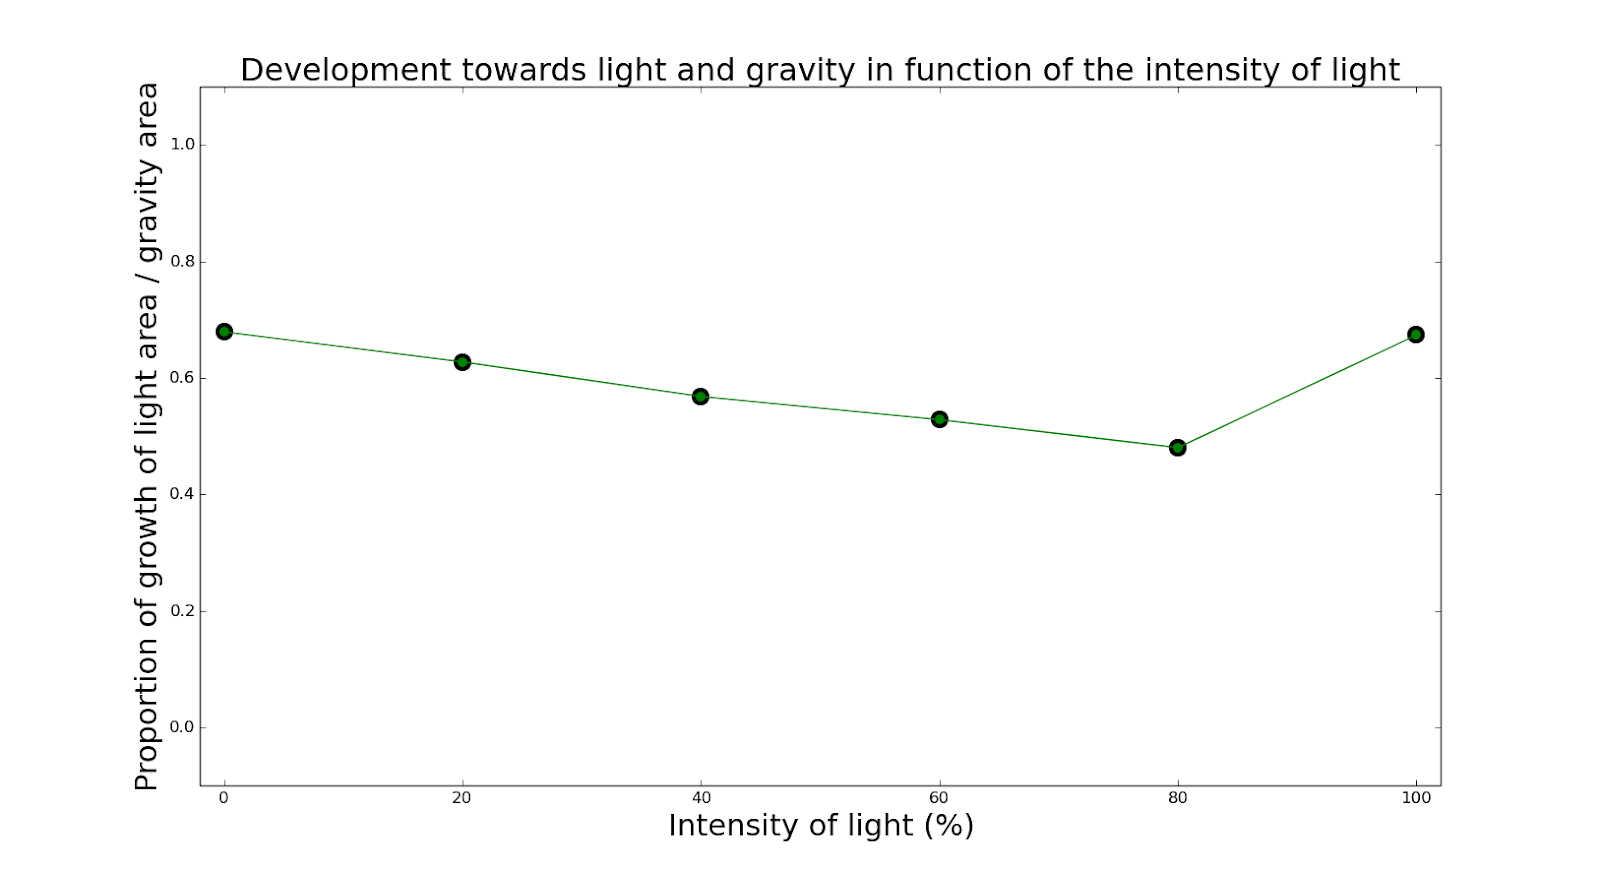
First, we chose to compare the area under and the one over the line: this would give us an idea of which factor of attraction would have been the strongest according to light intensity. Unfortunately for us, the organisms did not grow as planned:
mediationa.png
We cannot see any clear tendency on this graph: the areas were quite similar on the two sides of the plate (even for the controls!).

Therefore, after seeing that our first approach might not have been the best, we thought about comparing densities of development at each part of the line. We wanted to see if the density was higher when exposed to light rather than gravity. Again, we had quite a surprise :

mediationf.png

The density of development in both zones, above and below the line seems to be the same! It looks like the development was made without taking in account the influence of either light or gravity.

Bias

How can we explain such results ? Well, obviously we had a lot of bias during our experiment: the lack of oxygen, the fact that some light could have gone through the tape, and more importantly the fact that Phycomyces blakesleeanus would only develop its reproductive part (sensor for light and gravity) after 5 days… And our experiment only lasted 2 days.


Conclusion

As a conclusion, we can say that despite a lack of conclusive results, we analyzed precisely the parts of the experiment that could have gone wrong and are pretty sure that if we were to redo the experiment, we could be almost certain that results would be as described in the literature !


Bibliography


  • « Agar papa dextrosa ». Wikipedia, la enciclopedia libre, 3 janvier 2017. https://es.wikipedia.org/w/index.php?title=Agar_papa_dextrosa&oldid=95995361.

  • Barlow, P. W. « An introduction to gravity perception in plants and fungi — A multiplicity of mechanisms ». Advances in Space Research, Life and Gravity: Physiological and Morphological Responses, 17, no 6–7 (1996): 69‑72. doi:10.1016/0273-1177(95)00613-J.

  • Grolig, Franz, Peter Eibel, Christine Schimek, Tanja Schapat, David S. Dennison, et Paul A. Galland. « Interaction between Gravitropism and Phototropism in Sporangiophores of Phycomyces Blakesleeanus ». Plant Physiology 123, no 2 (6 janvier 2000): 765‑76. doi:10.1104/pp.123.2.765.

  • Corrochano, Luis M. « Sensory perception in the fungus Phycomyces blakesleeanus: a model organism for space research? », Vol. 41, 2016. http://adsabs.harvard.edu/abs/2016cosp...41E.376C.
  • Dennison, David S. « The Effect of Light on the Geotropic Responses of Phycomyces Sporangiophores ». The Journal of General Physiology 47, no 4 (1 mars 1964): 651‑65. doi:10.1085/jgp.47.4.651.

  • Galland, P. « The Sporangiophore of Phycomyces Blakesleeanus: A Tool to Investigate Fungal Gravireception and Graviresponses ». Plant Biology (Stuttgart, Germany) 16 Suppl 1 (janvier 2014): 58‑68. doi:10.1111/plb.12108.


Contact

If you guys wish to know more here are some things that could interest you !

Twitter : @Let_us_Fall                           

Github:
Storify:

February 3, 2017

Make your bet : Humans or machines ?


For one week, we had a interrogation : who or which is more able to estimate pressure caused by weight between a machine and a human hand? Nowadays, there is a basic idea that machines are more precise than humans. However humans are also able to feel something on their skin, and it’s always useful to know if something is touching you!
Humans have the ability to know where they put their hands. They can situated their body in space and feel when someone or something is touching them. This phenomena is called interoception. How does interoception work ? One part of the answer is that some sensors, called Merkel cells, are situated under our skin. The cells react when they feel something on the skin, even a low one, and communicate this information to our brain. Then, the brain makes an estimation of the weight. What about the machine sensitive to pressure variation ? These kind of machines are called FSR for force sensitive resistance. They convert the resistance changes into a weight. Afterwards, a computer can show an estimation on the screen. It is this mechanism that we used in our daily life when we cook using a scale.
That way, we brought face to face humans and machine, in order to test their rapidity (how long is the process to estimate a weight?) and accuracy (did they evaluate well the weight?) to pressure variation. Which sensor is the best? Make your bet! (and read this blogpost)


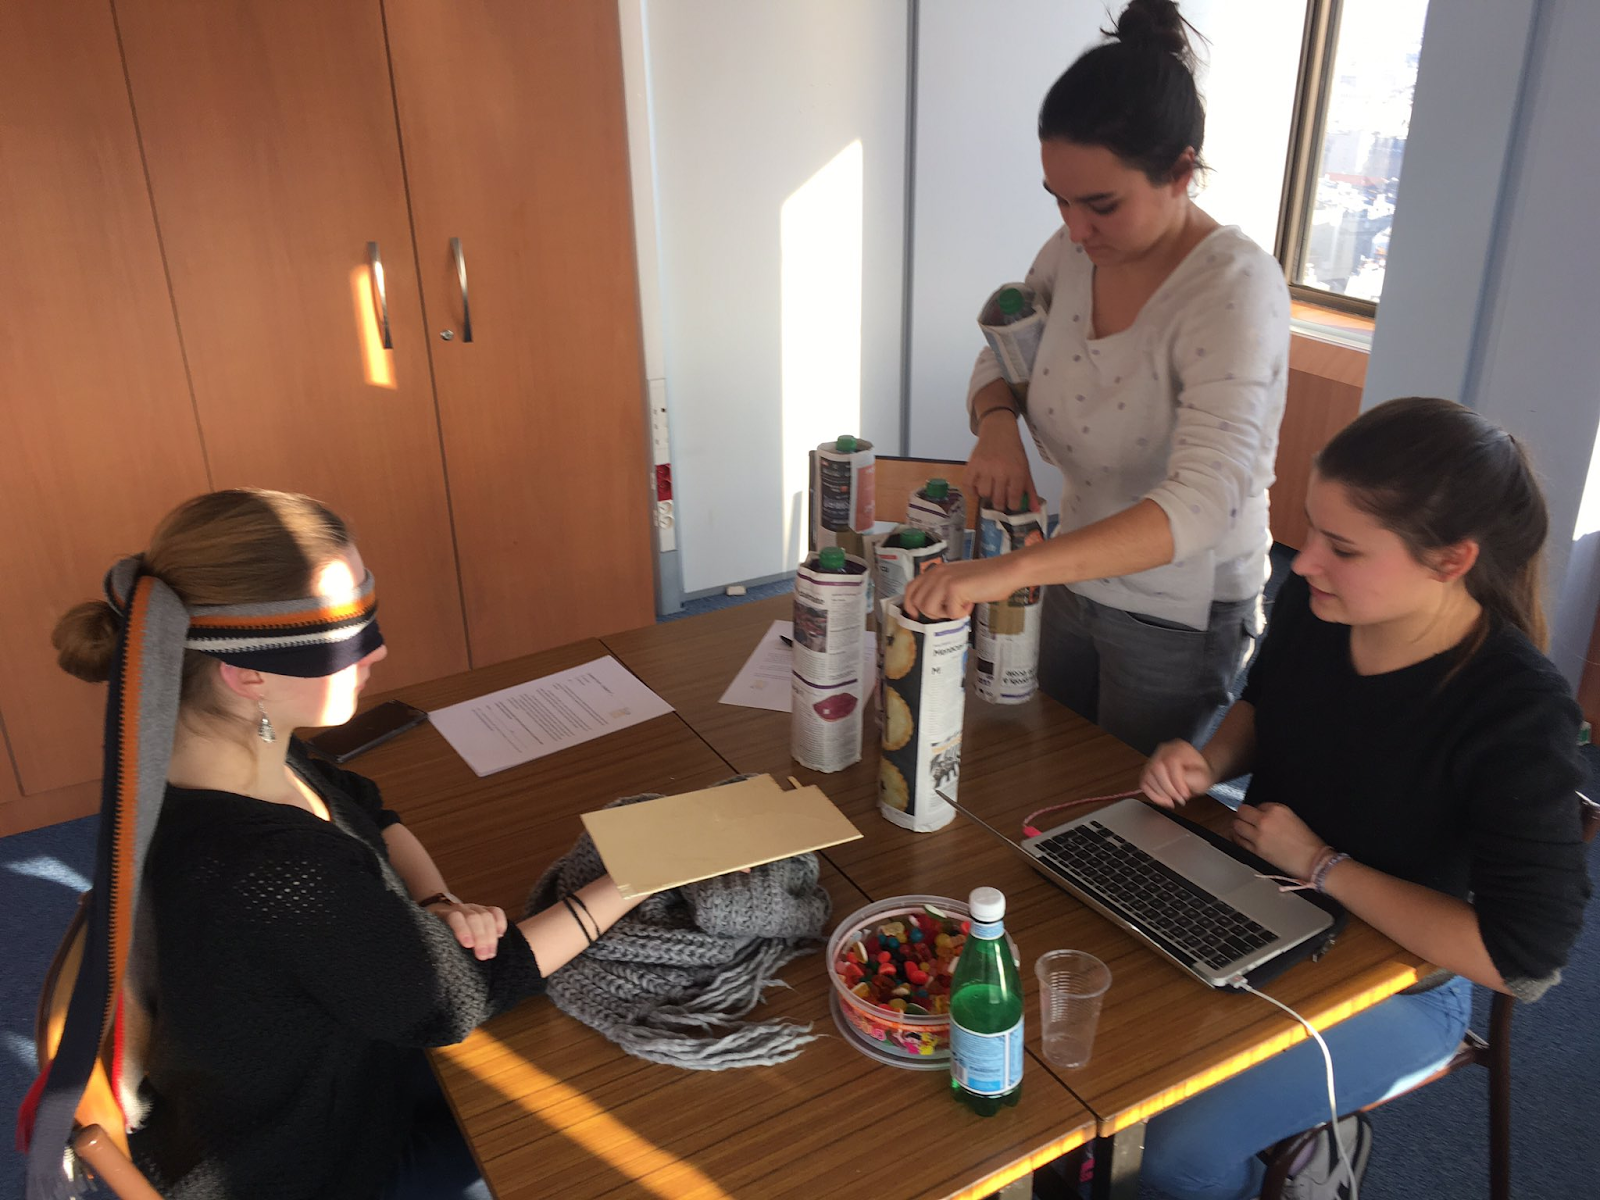
How did we made a comparison between these two sensors ? First, we asked people to come  one by one. Then, we put a board on their hand to balance our masses. We blindfold them. We prepared 5 bottles filled with 300g, 500g, 800g, 1000g and 1300g of water. We covered the bottles with paper journal to cover water noises. Then the process was the following : we put a 1 kg mass on their hand and told them it was 1 kg. Then we replaced this bottle with a new mass to estimate and waited for them to answer. We put the weight in a random generated order, and each mass was put 5 times. The one 1kg acts as a tare as was put in between each estimation to give the person an idea of what it represent. You also do this when you cook and don’t want your scale take in account the container. 

For the FSR sensor, we did exactly the same thing except that we build a set-up to put the bottle on 
the sensor because the sensor is very small!

We prepared 5 bottles filled with 300g, 500g, 800g, 1000g and 1300g of water. We covered the  

If you want to build your own arduino scale as we did, you can look at this video!


Do you remember which side you chose between human and machine? It is time to know if you guessed correctly!
First characteristic, which sensor has the best time response? The time response is to quantify how fast a sensor is able to estimate the weights. We started to measure the time the moment we put the bottle on the hand/sensor, and stopped when we had an estimation.

In average, the sensor takes one second to make an estimation, against 5 seconds for a human. Machine 1, human 0.

Now for the second characteristic: which sensor has the best accuracy? We say something is accurate when it is to be able to estimate a weight correctly. In other words, if we put 300 grams and the answer is “300 grams”, then we can say that it is accurate.
Our results show that humans are better than FSR on this point. Indeed, we calculated the average of the response for all the participants and for each weight. We observed that, in average, humans are more accurate than FSR. For instance, for 300g, we obtain an average of 300g for humans while the FSR estimated the weight at 800g... The results from the FSR may show a saturation. Indeed, we observed that the value given by this sensor is always around 900g, and was never higher than 1000g. This means that the sensor can’t properly estimate heavy objects. Machine 1, humans 1.

In conclusion, our two sensors were complementary. The FSR is quicker than humans while the opposite was observed for the accuracy. It is interesting to notice that we had the time to repeat the experiment only 12 times for the humans and 4 times for the FSR sensor. This means that our results aren’t precise enough to make any definitive statement. Indeed, if we don’t repeat an experiment enough, there are a lot of bias such as mood (for humans) or shape and position of the sensors. If you are interested in weight estimation you can check the study of the previous year here[1].
If you would like to have more precision on our protocol and do it at home, you can check our github repository![2]


To go further :
How to make a scale with arduino ? https://www.youtube.com/watch?v=1p8AE_QA8qQ
How skin fill pressure : “Responses in Glabrous Skin Mechanoreceptors during Precision Grip in Humans. - PubMed - NCBI.” Accessed January 24, 2017. https://www.ncbi.nlm.nih.gov/pubmed/3582527.

You can find more ressources on our Github or see our Storify composed of the best moments of the week !


Blog written by the @Proprioscale Team, composed of @Clément, @Daphné and @Léonie.

January 23, 2017

Researchers hate them : Reaction to intensity of blue light of Daphnia and arduino sensor

Blue light intensity variation: How do Daphnia and electronic sensors react to it?
                                    
Team members: Tanguy Chotel, François Sacquin, Sarah Talon Sampieri
Are electronic sensors really better at their functioning, considering they are conceived by inspirations of biological mechanisms? Is computer really powerful compared to human brain? What are its limits and what are its strengths? We tried to focus our research on this questionings this week, taking light sensors as our term of comparison.
Daphnias, that are little crustaces living in freshwater, are known to change their phototaxis, which is the movement of the organisms toward or against the light source, according to the increase of light intensity: the increase in intensity of light increases the movement downward of daphnias. Afterwards, we found that daphnias tend to have a vertical movement upward when exposed to blue light. We wanted to have an insight to this founding by changing one parameter: what does happens if we change the intensity of light? Do daphnia will keep this vertical movement? If yes, in what degree? If not, how will they behave?
Secondly, we will compare our findings in the reactivity to light of daphnia to the increase of blue light to the photoreactivity of electronic sensors, that, in our case, will be an arduino equipped with an intensity sensor and exposed to blue light. What is an Arduino ? check THIS out !
                                            
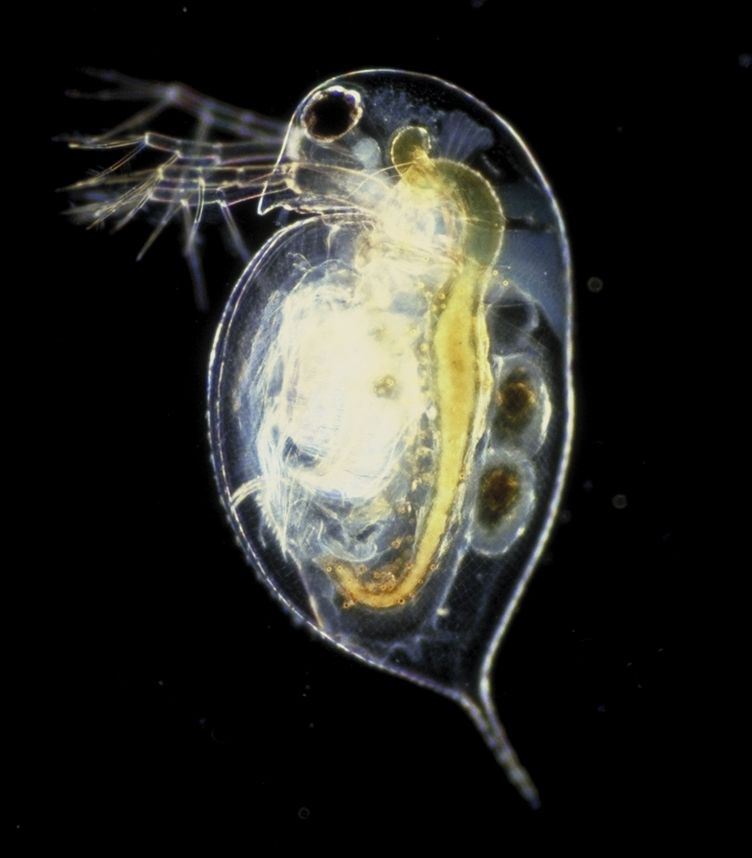
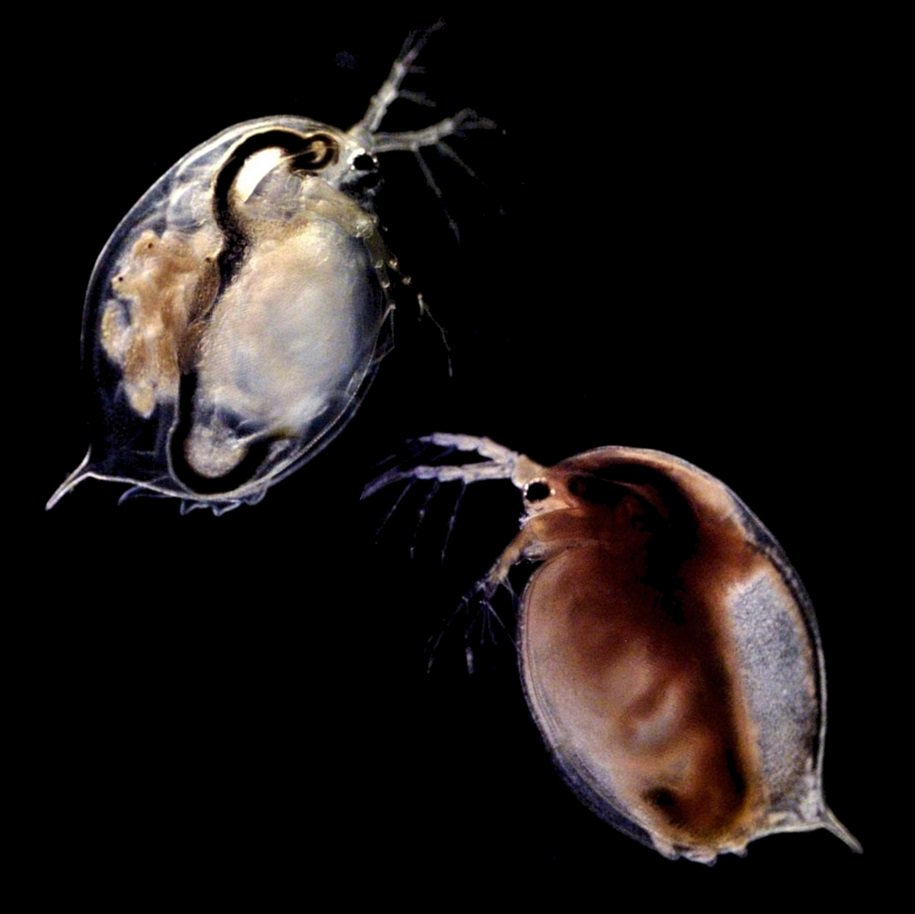
Description of the image: Daphnia pulex, one of the two easily available species that can be found in nature. The other one is called Daphnia Magna, and it generally looks like a little bit bigger in size than Daphnia pulex.

Here is a really cool video about Daphnia doing upward movement when exposed to blue light, and going downward when exposed to red light !

Biological Experiment
As we wanted to test how daphnia reacted to the variation of intensity of blue light, we exposed our populations to eight different intensities of light from 30 arbitrary unit(a.u) to 240a.u, in 8 steps. This was made by putting an arduino with a blue led on each beaker, and recording videos for each intensity of light.
To have as many data possible and do an accurate data analysis, we did the same experiment with 3 different populations, 3 times each. Between each recording, we made sure to reset to standard conditions of the experience by waiting 30s of dark before starting with the new intensity of light. (In order to do that, we did all our experiments under a cardboard ! to simulate a “Dark Room”.
Finally, we measured the distribution of daphnia in the beakers depending on the variation of blue light intensity by compartmentalizing the beaker from level 0 to level 4, starting from the bottom to the top. This allowed us to count how many daphnia were present for each level in each video. 

Arduino Experiment

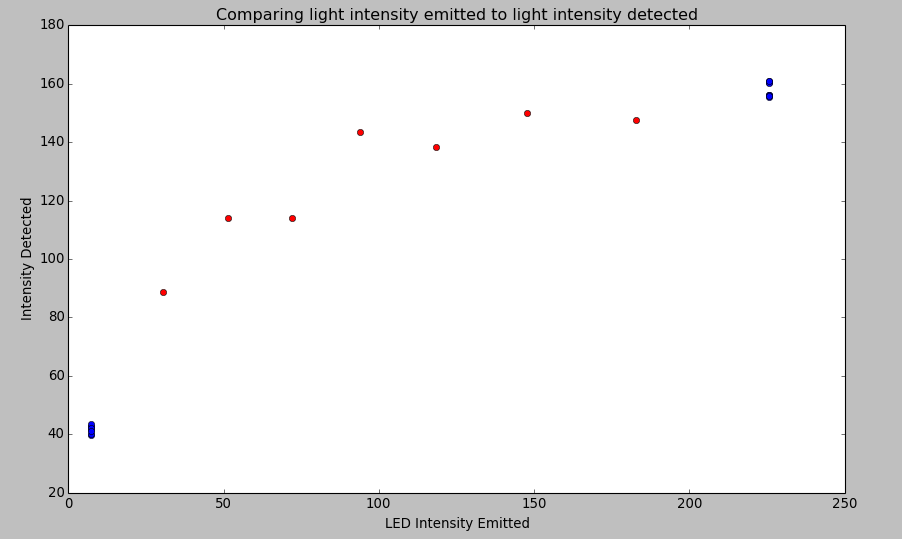
For the Arduino part, we made the exact same thing but switched the beakers with the electronic intensity sensor. The intensity perceived by the sensor were directly converted and analysed to get these awesome graphs describing the intensity perceived over the intensity given.

On the graph above, we study how a population of 23 Daphnia evolves spatially under different blue light intensities. In order to better graph our data, we represented our population over time through differential populations. Each point is the population in a section after 30 seconds of light exposure subtracted by the same section population after 10 seconds. Thus, a point above the zero line indicates an increase.
For the electronic sensor, we noticed that the photo-resistor was very accurate for detecting light intensities but its range was very unpredictable due to calibration problems that affected all sensors.

Conclusion 
We thus concluded that electronic sensor can be precise and accurate but have to be scaled 
back by a function to real light intensities due to range calibration. The biological sensors on the other hand did not end in any significant conclusion as Daphnia did not behave as we expected them to. Overall, this project could be further continued by studying the impact of other wavelength on the Daphnia and comparing as many sensors as possible to find the best possible function of transition intensity => lux.

If you want to know more, check out our full work !

Mail : Photons.unchained@gmail.com   


Sources :


Daphnia:


Nédélec, François J. "Mechanism of phototaxis in marine zooplankton: Description of the model." (2008).


van Gool, Erik, and Joop Ringelberg. "The effect of accelerations in light increase on the phototactic downward swimming of Daphnia and the relevance to diel vertical migration." Journal of plankton research 19.12 (1997): 2041-2050.


Steams, Stephen C. "Light responses of Daphnia pulex." Limnol Oceanogr 20 (1975): 564-70


Ringelberg, Johannes. "The positively phototactic reaction of Daphnia magna Straus: a contribution to the understanding of diurnal vertical migration." Netherlands Journal of Sea Research 2.3 (1964): 319IN1335-334IN2406.


Arduino


http://www.mouser.fr/Search/ProductDetail.aspx?R=1384virtualkey54850000virtualkey485-1384


http://www.mouser.fr/ProductDetail/Adafruit/161/?qs=%2fha2pyFaduidPXPXSuFTA5DDZdShRkexJbM%2fC0FaJ9I2cgisBToc9Q%3d%3d


What is the reaction time variation of Daphnia depending on changes in light stimulus location ?

What is the reaction time variation of Daphnia depending on changes in light stimulus location ?

For this first week of Biosensors, the theme is LIGHT! We’re going to compare biological and electronical sensors properties with light!
We chose to study the variation of reaction time of Daphnia individuals when they are exposed to increasing color-alternating frequency.
But after a little research, we observed that information about phototaxis (behavior under light conditions) with Daphnia is unclear and sometimes sources contradict others sources.
“Animals reacted to ultraviolet light (260±380 nm) with negative phototaxis, whereas visible light (420±600 nm) caused positive phototaxis.” U. C. Storz and R. J. Paul in “Phototaxis in water fleas (Daphnia magna) is differently influenced by visible and UV light” in 1998.
But we can see in this video, and in other sites that the positive phototaxis (reaction to light) appears with blue light, and red light has no visible effect…

Preparation of our experiment
For our experiment, we tested the reaction of Daphnia to the red and blue light. We designed an arduino code to be able to alternate blue and red light during at a given frequency. We also designed a code to be able to write data collected by an RGB sensor (TSC 3200). The totality of our codes are on Github.
Wednesday (18/01/2017), we bought Daphnia at Truffaut, but were disappointed when we saw that they’d almost all died. We must wait until Thursday to begin the experiment with new organisms.


First experiment
Thursday morning, we saw only juvenile daphnia move in the water. We collected about 20 of them, put in a beaker of de-chlorinated water. During all the experiment we observed no vertical migration like we had hoped.
C2jZ0zhWgAA1Uw7.jpg
Thanks the group “Photons Unchained” who brought new Daphnia, we were able to do the experiment during the afternoon with adult and healthy Daphnia ! But we observed no vertical migration with adults either… But after all, this experiment showed that Daphnia are attracted by light ! They don’t migrate vertically, but horizontally !

Final experiment: Friday (20/01/2017)
We put twenty adult Daphnia in a large petri-dish with a diameter of 13,7cm and we traced areas on a piece of paper at the bottom of the container. We alternately turned on blue LED that were placed on opposite sides of the plates and timed how long it took for five daphnia to swim into our target areas underneath the lights.
IMG_20170122_134448.jpg
We do the same experiment for each frequency, and we repeat the light changes 5 times for each frequency.
We choose to make lights switch every 1,30min, 2min, 3min, 3.20min, 4min and 4,20min.
For our first panel of daphnia, we observed a small area and we tried with shorter times than 1.30, but the daphnia did not have the time to migrate fast enough, so we chose to extend our target area of observation and decrease our alternance frequencies.
We performed controls by having one experiment where both light sources were on simultaneously and another where no light sources were on. We then observed how the Daphnia were placed throughout the Petri dish and confirmed that the light did have a noticeable effect on migration behavior.
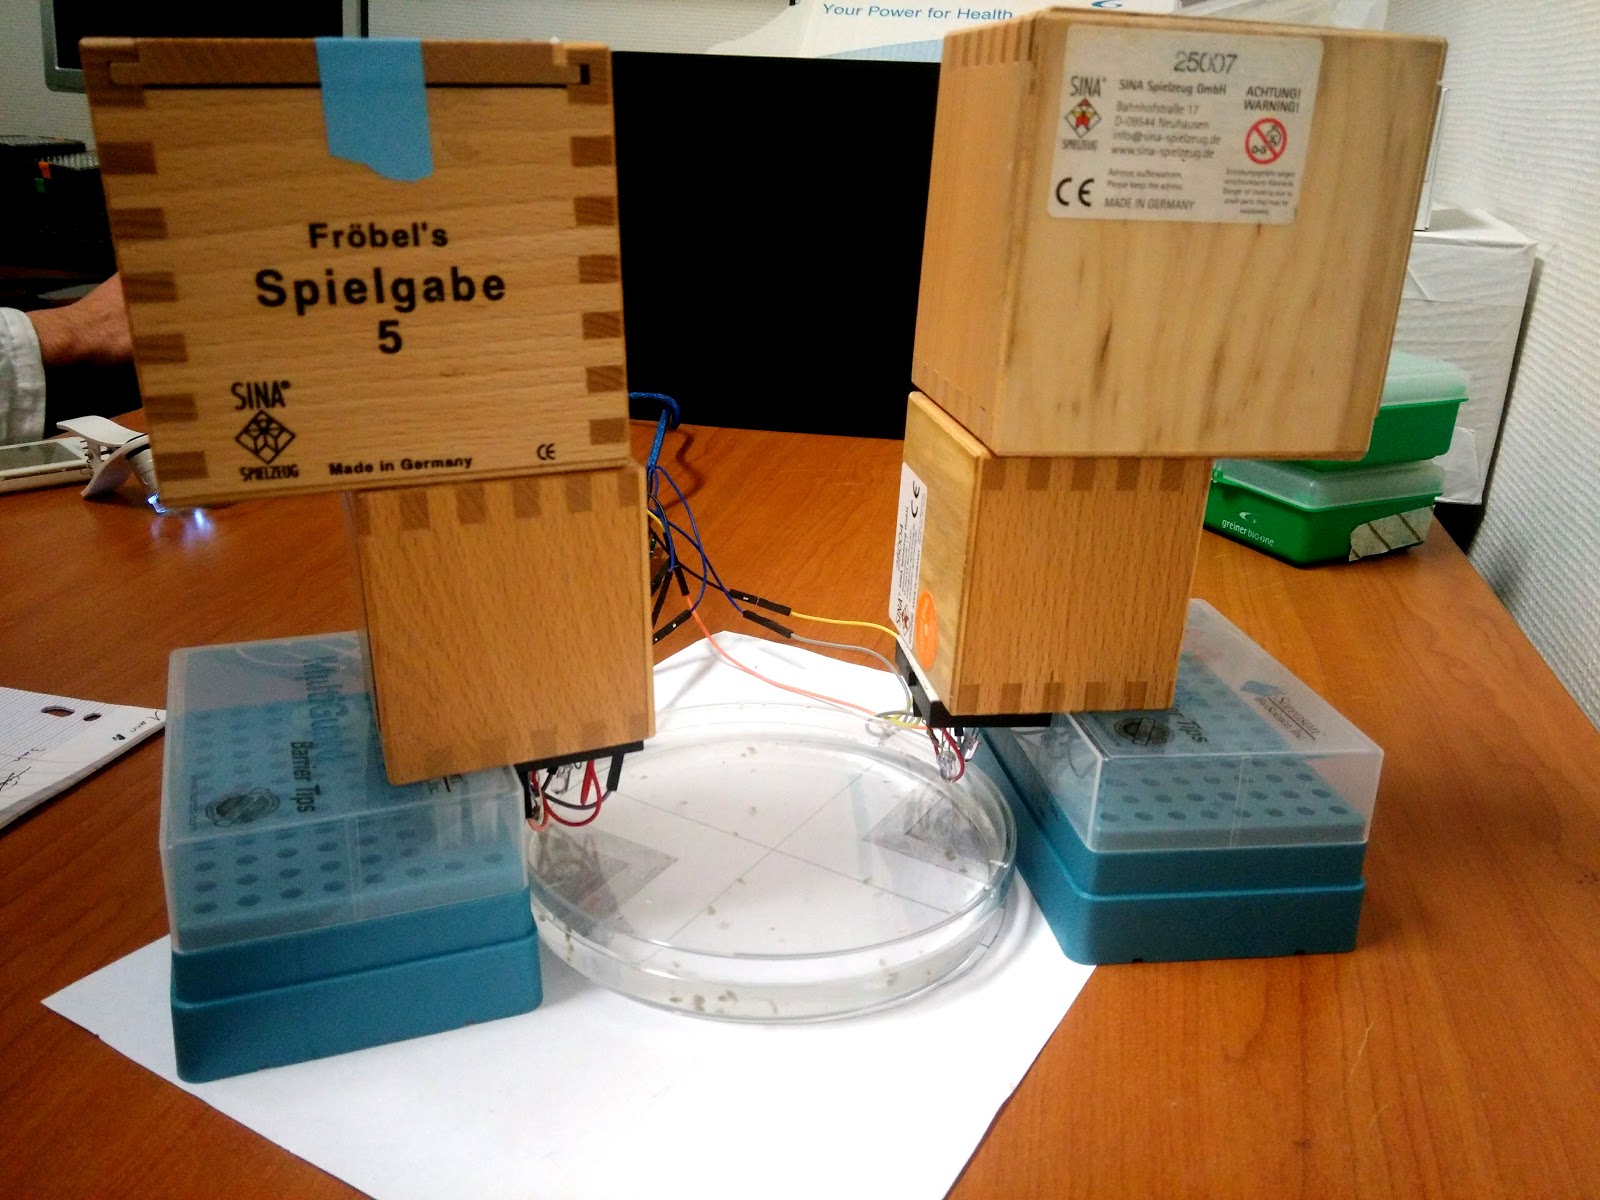
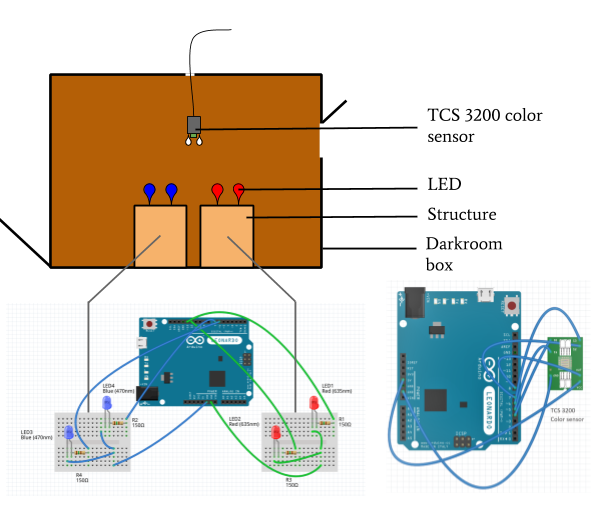
During the afternoon, we did not have access to the laboratory, so we did an experiment with the electronic sensor in a room with a low quantity of light, and we put the sensor and the LED installation in a box.
We took 5 measurements for each of the different frequencies of lighting.
sensor2.png
Here, we changed the light's color rather than its location to observe the captors reaction.

We recorded the measurements just before the changing of light to be able to have measurements according to time and see values stabilisation of the sensor.
We performed positive and negative controls with the sensor by conducting the experiment once with only red light, once with only blue light and once without.
This confirmed that the reaction we were observing was truly due to the changes in light during other experiments.
We could then determine the time needed for the stabilisation of the sensor’s data.
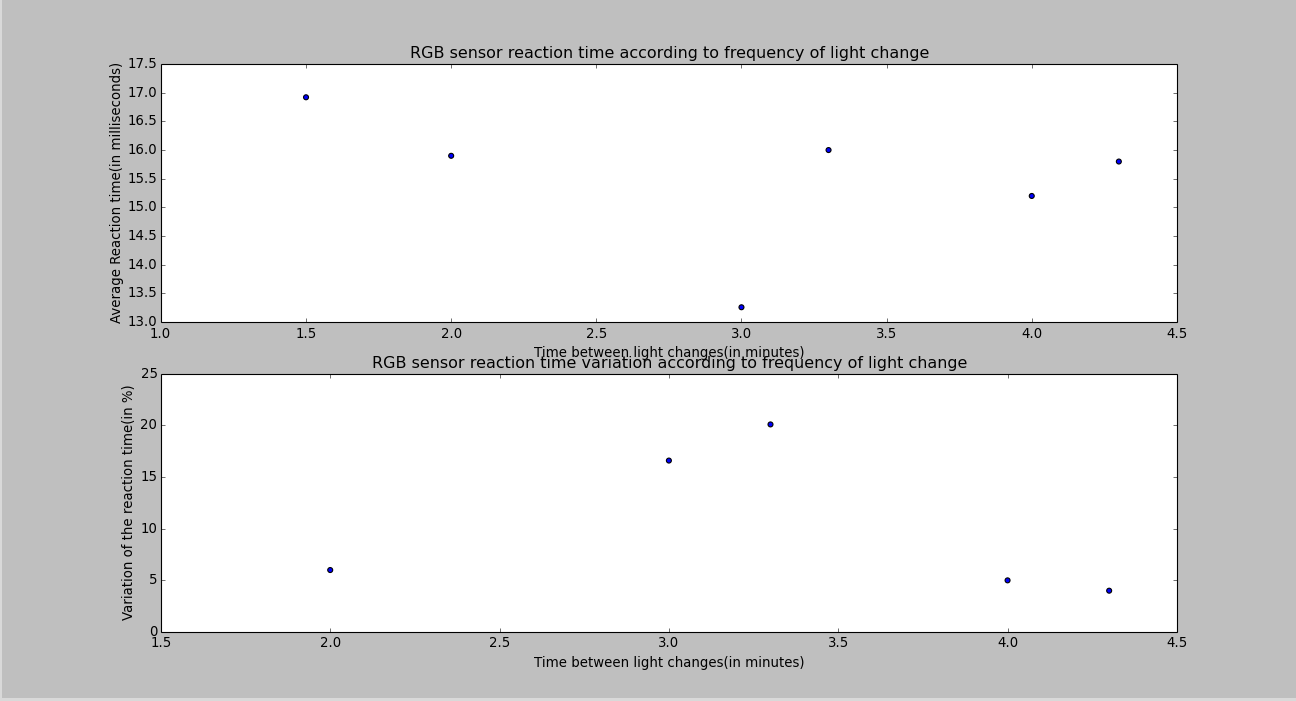
We determined that the sensors’ reaction time was between 10 and 20 milliseconds and was a constant. We obtained these results with the sensor:
 

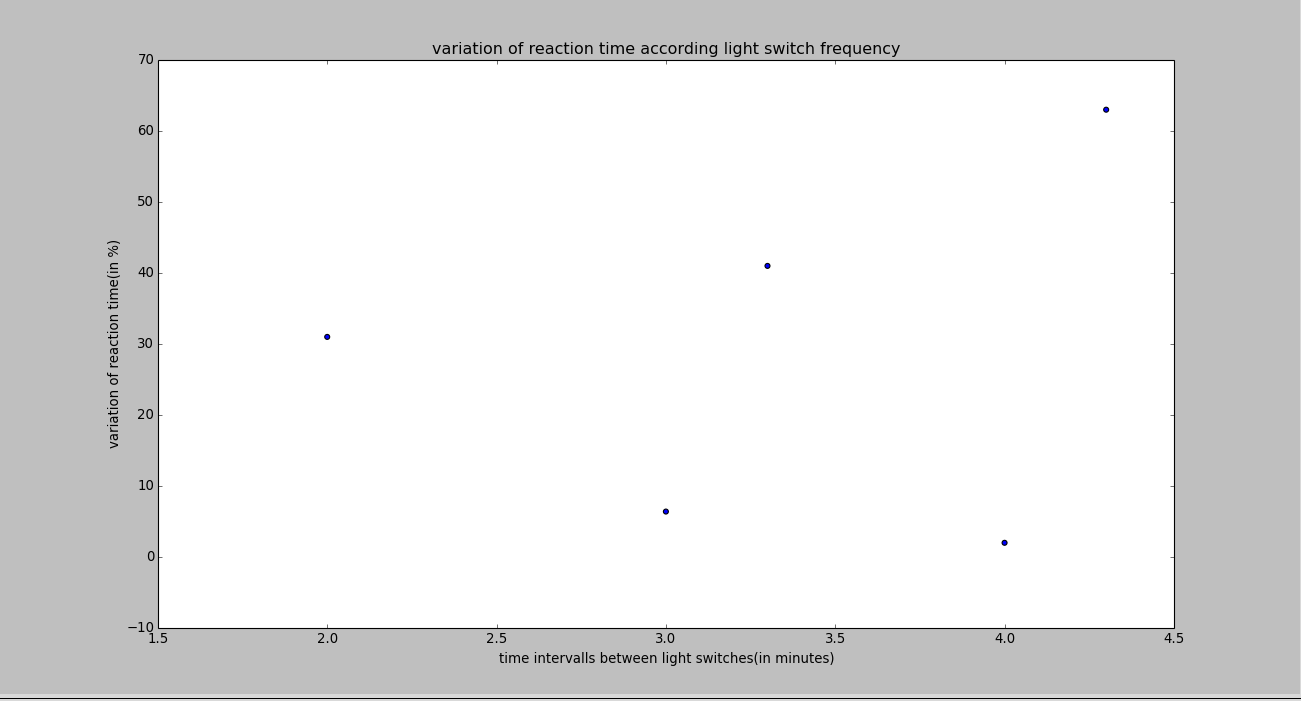
For the experiment with Daphnia, we obtained these results:

Results received from experiments with Daphnias showed highly variable reaction times, but no clear correlation between these variations and the frequency of the alternating lights. This is perhaps because our method of measuring individuals was very imprecise and that the organisms did not always behave as expected, perhaps due to wear or other factors that were not taken into account.

If you want to learn more :
Github
Storify 
Twitter

Sources : 
Ebert, Dieter. Introduction to Daphnia Biology. National Center for Biotechnology Information (US), 2005. https://www.ncbi.nlm.nih.gov/books/NBK2042/.

Cellier, S., M. Rehaïlia, J.-L. Berthon, et B. Buisson. « Le rôle de l’œil, dans les rythmes migratoires de Daphnia magna et Daphnia longispina (Cladocères) ». Annales de Limnologie - International Journal of Limnology 34, no 2 (1 juin 1998): 159‑64. doi:10.1051/limn/1998015.

KN, Zhang L. and Baer. « The influence of feeding, photoperiod and selected solvents on the reproductive strategies of the water flea, Daphnia magna. - PubMed - NCBI ». Consulté le 20 janvier 2017. https://www.ncbi.nlm.nih.gov/pubmed/15092821.

Storz, U. C., et R. J. Paul. « Phototaxis in Water Fleas (Daphnia Magna) Is Differently Influenced by Visible and UV Light ». Journal of Comparative Physiology A 183, no 6 (1 décembre 1998): 709‑17. doi:10.1007/s003590050293.

« Check out the course “Tableaux et jeux de lumière avec plusieurs LED” on OpenClassrooms ». OpenClassrooms. Consulté le 20 janvier 2017. https://openclassrooms.com/courses/programmez-vos-premiers-montages-avec-arduino/jeux-de-lumiere-et-tableaux-avec-plusieurs-led.

« Sequential_blinking.ino ». Dropbox. Consulté le 20 janvier 2017. https://www.dropbox.com/s/bivwdnehp7ln1iq/Sequential_blinking.ino?dl=0.

« Éliminer le chlore de l’eau du robinet gratuitement ». consoGlobe, 7 mai 2016. http://www.consoglobe.com/eliminer-chlore-eau-robinet-gratuitement-2895-cg.

« Anatomy of a Mini Breadboard - Pimoroni Yarr-niversity ». Consulté le 20 janvier 2017. https://learn.pimoroni.com/tutorial/170pt-projects/anatomy-of-a-mini-breadboard.

« Arduino Color Sensing Tutorial - TCS230 TCS3200 Color Sensor - HowToMechatronics ». Consulté le 23 janvier 2017. http://howtomechatronics.com/tutorials/arduino/arduino-color-sensing-tutorial-tcs230-tcs3200-color-sensor/.


Blog disclaimer

The content created by the Learning thru research Student Bloggers and those providing comments are theirs alone, and do not reflect the opinions of Centre de recherche interdisciplinaire, University Paris Descartes or any employee thereof. The authors of posts and comments are responsible for the accuracy of any of the information supplied on this blog, as well as for any content copyright issues.