Showing posts with label chemical gradients. Show all posts

February 8, 2016

Sea Urchinies project

Sea Urchins Project


Hello dear Reader,

We are the Sea Urchinies team. The global aim of the our one-week project was to compare chemical gradients on a biological sensor and on an electronic one in different salty environment. But what is a chemical gradient ? A chemical gradient is a difference of concentration of molecular entities. An example of that could be sirop in water. When you add water after having put sirop at the bottom of the glass the sirop will take time to diffuse and the bottom of the glass will have much more sirop than the top !
Therefore, we realized two different experiments. The electronic experiment was made thanks to a Grove Water Sensor. We will later explain what it is. For the biological experiment, we used sea urchins’ gametes (ovum and sperm cell). The goal was to observe gametes movement according to the salt concentration. The gametes of sea urchins follow chemotaxis to mate. But what is chemotaxis ? It is the movement of an organism in response to a gradient of concentration. In our case, the ovums - thanks to their hormones creating the gradient of concentration - attracted  the sperms to them. We choose to focus on :

Is chemotaxis in sea urchin a better indicator of salinity then the grove water sensor ?

domotique-info-grove_water_sensor.jpg
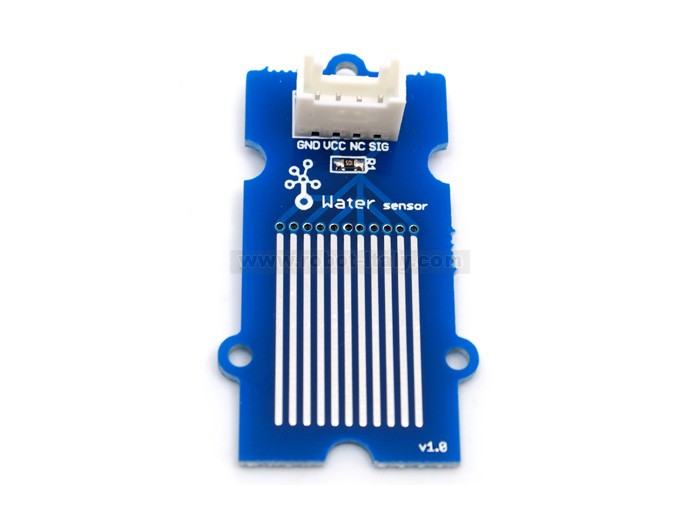
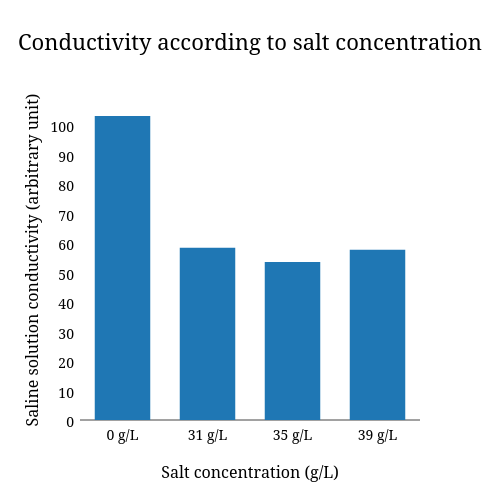
We first started by the electronic experiment. So what is the Grove Water Sensor ? Thanks to the data it collects the sensor indicates whether he is dry, damp or completely immersed in water by measuring conductivity (capacity to conduct electrical current). We chose this device because the more ions there are in water (represented here by the concentration of salt) the more conductive the water will be. To launch it, we created different salt concentration of 0 g/L, 31 g/L, 35 g/L, 39 g/L. The 0g/L was there as a reference to see if the sensor worked well while the other concentrations belongs to the range of salt concentration that can be found in the ocean. Thanks to a Grove water sensor, we obtained salt concentration of our solutions in arbitrary unit.

oursponte.gif
We then did the biological experiment. We started by extracting the eggs and sperms cells of sea urchins. To do it, we put the top of the sea urchin facing down on a jam jar full a salty water. This position make them released their gametes. To identify whether it was a female or a male, we looked at the color of the ejaculation. If it looked orange-ish, it was a female and if it was whitish, it was a male. After differentiating the gametes, we put a drop of sperm and a drop of ova on opposite sides of a microscope slide in different saltwater concentration (same salt concentrations as the electronic experiment but without the 0 g/L).


We collected our data and for a better visualization, we decided to represent them on a histograms. For all the concentrations, we represented the average of all the data that we have collected.

Conductivity according to salt concentration.png

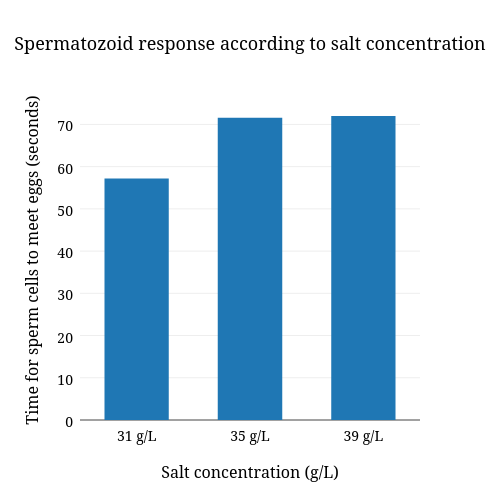
Spermatozoid response according to salt concentration.png
Figure 2 : Data of the electronic experiment
Figure 3 :  Data of the biological experiment


Interpreting the data

For the electronic experiment, we expected an increase of the conductivity with the increase of the concentration of minerals. However, this is not what our electronic sensor showed us. Indeed, there is no link between the concentration of salt and the conductivity of the water. Some possible options to these strange results are that we did not used normal salt but aquarium salt or we might not have programmed the sensor the right way.  
For the biological experiment, we can see that as the salt concentration is increasing the time for sperms to meet increases. This is also not what we expected but we had no precise idea of what we shall expect. Plus, we made an experimental mistake as we have found fertilized eggs before introducing eggs on the slide. For this reason we can’t know if the sperm we saw were coming from the opposite side of the slide or directly from the egg solution. We thought that we should have take the sexuals cells at the beginning before mixing the urchin in the aquarium.  

To conclude, we could say that none of our sensors were precised enough and no conclusion can be given on the impact of salinity on the mating of sea urchin. So, we can not know what will be the impact of an increase in salinity of the ocean.
Now you might want to know how sea urchins have kids in real life ?! And you will find that by clicking on video. And for more scientific contain on sperm chemotaxis you can read this article.
Have a nice day and see you soon !


Follow us on Twitter : @SeaUrchinies

Written by : Lucile Szpiro, Pauline Gasquet, Floriane Coulmance--Gayrard & Alexandra Perron

Is Daphnia’s heart more sensitive to caffeine than a spectrophotometer?


What is the common point between coffee, tea, Coca Cola and other energising drinks? Caffeine of course!

Caffeine is known to stimulate the central nervous system, a part of the nervous system including brain and spinal cord. That is why you could noticed that your heart rate was increasing after drinking a cup of coffee or any of the previous drinks. But is it the same for other species? During this Biosensor week about chemical gradients, we wanted to focus our study on Daphnias, small planktonic crustaceans of maximum 5 mm in length. It is an interesting organism for biologists as we can easily observe several organs thanks to its transparent body. So we decided to observe Daphnia’s heart: will it beat faster when the caffeine concentration of their environment is raised? The main goal of our project was indeed to find a correlation between caffeine concentration and their heart-rate, to finally use Daphnia as a biosensor able to determine the caffeine concentration of a solution. We chose to compare Daphnias with another sensor, a UV spectrophotometer. This tool quantify “how much does a solution absorb light?” as the optical density of the solution. So we expected that the more the solution is concentrated in caffeine, the more it absorbs light and therefore, the higher the optical density is.

We mentioned the term chemical gradient above, but you may ask, what is a chemical gradient? In biological systems, concentration imbalance is very important as different kinds of chemical substances are often unequally distributed on both sides of cells membranes for example. Hence, particles move from the higher concentrated region to lower concentrated region, activating lots of complex metabolic process.

In our case, we wanted to see how Daphnias and spectrophotometer would respond to different concentrations of caffeine, namely:
  • No caffeine (0 g/L)
  • 0,2 g/ L
  • 3 g / L

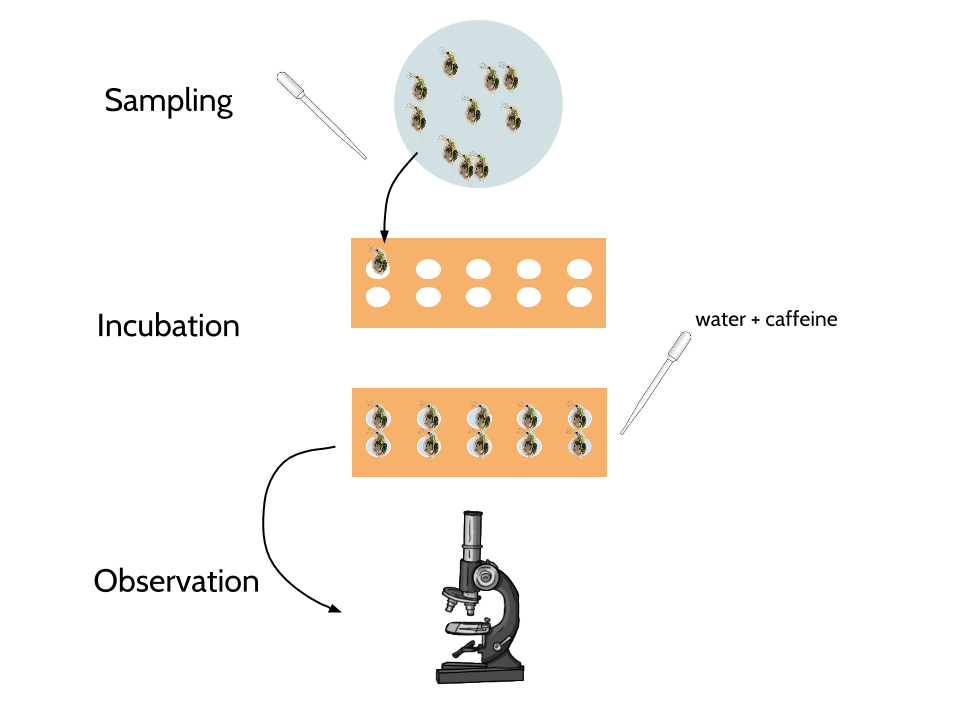
How did we observe Daphnia’s heart reaction?
Biological setup.png
Figure 1: Experimental set-up

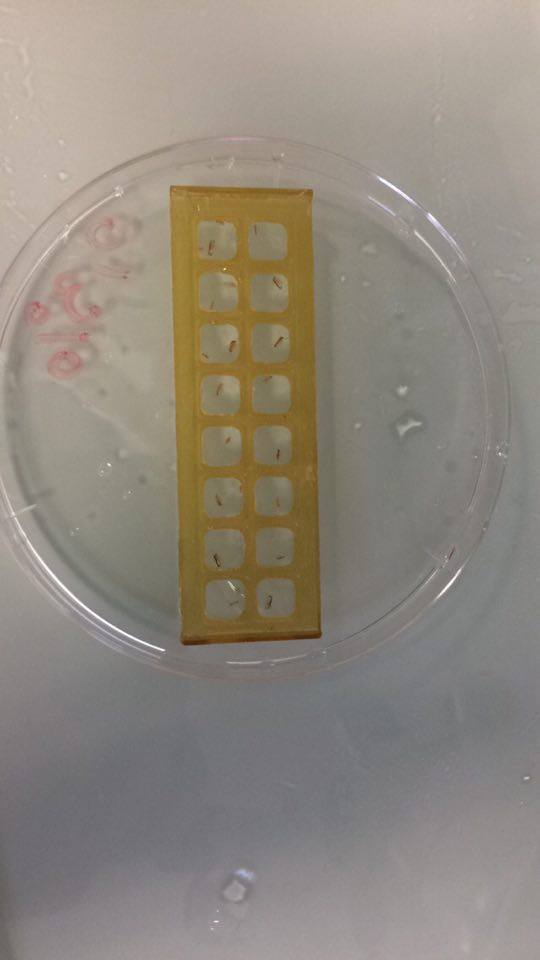
First of all we had to remove Daphnias from the main aquarium into a specific microscope slide with 10 wells (figure 2, figure 1: Sampling). Indeed, it allowed us to observe Daphnia individually and to prevent them from moving to much.

Figure 2 : A microscope slide with 10 wells and Daphnias inside


Once they were on the slide, we added one of the solutions thanks to a pipette (figure 1: Incubation).
We let Daphnia 5 minutes in this environment with caffeine. Indeed, we knew from a preliminary small study that the action of caffeine on Daphnia organism would be at its maximum after 5 minutes.
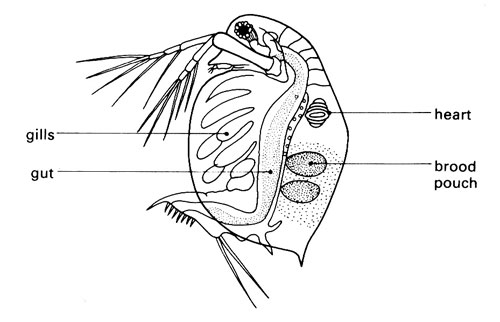
Finally, we could observe Daphnias with a binocular magnifier calibrated at the 5x magnification (figure 1: Observation). We counted the number of heartbeats of every Daphnias for 10 seconds. Are you curious about seeing a Daphnia’s heart closer? Look at this video !
Afficher l'image d'origineHint: Look at this drawing to localise their heart.


We studied 30 Daphnias for each concentration: with a large number of replicates we can reduce the noise in our measurements. Noise can be due to errors while analysing some Daphnias or to abnormal heart rate because of differences in Daphnia’s age, size or physical activity… So we used for the biological experiment more or less 90 Daphnias.

caffe.png
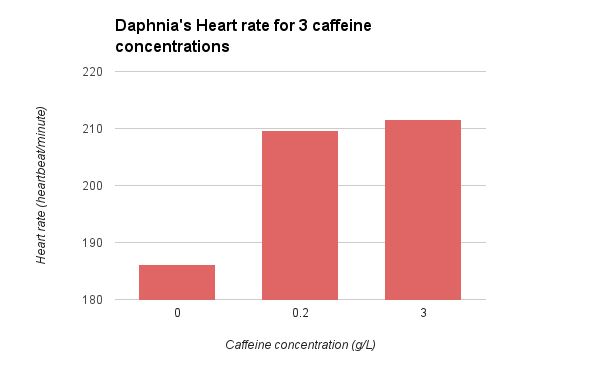
Figure 3: Results

Our results (figure 3) suggest that as expected, Daphnia’s heart rate effectively increased as the caffeine concentration was raised: in average, we counted 20 heartbeats more per minutes, which correspond to an increase of around 10%. However, Daphnias did not sense the difference between 0.2 g/L and 3 g/L concentrations, maybe because we had already reached the limit viable heart rate at 0.2 g/L of caffeine. Moreover, the 3g/L concentration killed the majority of Daphnias…


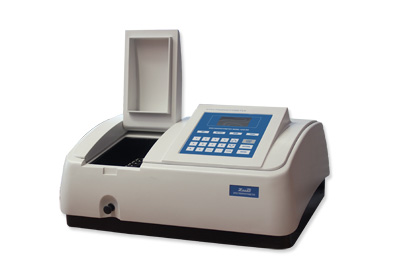
As we said before, we wanted to compare the sensibility of Daphnias to caffeine with the sensibility of an electronic tool: a spectrophotometer (figure 4).

http://www.labotienda.com/imagenes/fotos/espectrofotometros/54251050.jpgFigure 4: The very spectrophotometer

We expected to find a proportional relationship between the concentration of a caffeine solution and its optical density, according to the very famous Beer-Lambert law in chemistry. To do so, we diluted a solution of caffeine several times by 10 to obtain 7 solutions from 1g/l to 10-6g/l. Then, we measured the optical density of each solution and… faced a problem. We obtain 0% for every solutions. We think that we should have diluted caffeine with sulphuric acid or used extracted caffeine rather than pure one.


Thus, in the context of our experiment, Daphnia is a better sensor of caffeine concentration than the electronic one, as their heartbeats were effectively affected by caffeine. To go further, we would like to test more concentration around 0.2g/L on Daphnias. The temperature and light exposure, which affect Daphnia’s heart rate, would better be controlled to decrease the experimental noise… Also we could test some method to make accurate heart rate count, using a stroboscope, usually used to make a cyclically moving object appear to be slow-moving, as it is explained in this article (Rachel Foster (1997) A stroboscopic method to investigate the effect of caffeine on Daphnia heart rate, Journal of Biological Education, 31:4, 253-255, DOI: 10.1080/00219266.1997.9655573): We would also improve the electronic sensor, or test another one (a pHmeter for example).

 In any case, 1684 humans all around the world are sensing caffeine effects each second while drinking a cup of coffee...

February 7, 2016

Human’s tongue VS Grove Water Sensor


Which between lemon and orange is the most acid (sour)?
The answer is obvious: lemon !


We, humans, can sense different tastes (bitter, sour, salty and sweet) thanks to our tongue. But how? Our tongue is covered of many small buds, each connected to more than 100 receptors that are also connected to our brain. So when our tongue is in contact with lemon, our buds will send a message to our brain and our brain will think: “Oh this is very acid!”.
Here is a funny video showing a baby trying lemon for the first time.


Human’s tongue (connected to the brain) is very good example of a biological sensor, as it can differentiate different tastes. The tongue is also able classify flavours from less tasty to more tasty (orange, for example, seems less acid compared to lemon).


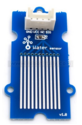
Biological sensors are not the only ones that can sense and classify different “concentrations” of tastes. The Grove Water Sensor is an example of an electronic sensor which can detect water and differentiate different salt concentrations. But again, how? As you can see on the image, this sensor is composed of a grid of electrodes which can sense the presence of ions in water. Salt is mainly made of ions, so the Grove Water Sensor can easily make the difference between different salt concentrations in water.


So which between the human’s tongue and the Grove Water Sensor can best sense different concentrations of salt in water?


This is a question we (a team of bachelor students) tried to answer this week, by performing series of experiments.


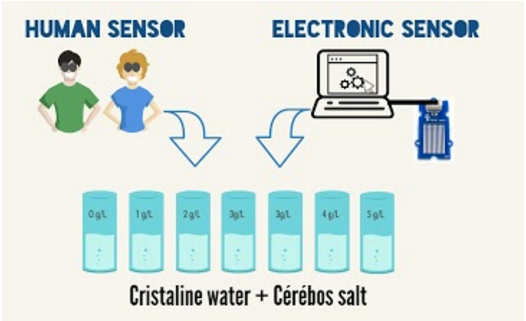
So what were the experiments? First, we asked 30 people (mostly students) to try and classify cups of water with different salt concentrations (0, 1, 2, 3, 4 and 5g/L) from the lowest salt concentration to the highest. These people had 3 mins to perform this task, in the way they wanted. Also, in the experiment, we disposed 2 cups instead of 1, with the 3g/L concentration, to test human’s ability to recognise the same concentrations.
Before we started the chronometer, and to make sure they react to salt, we let them taste two cups, one filled with only water, and the other with water and the highest salt concentration they would encounter during the experiment.


Then, to compare the human’s salt concentration classification with the Grove Water Sensor we built a simple electrical circuit with this sensor connected to an Arduino Uno and a computer. Wait… what is an Arduino Uno? It is an electronic device that records data and sends it to a computer, thanks to an informatic code. So with this electrical circuit, we were able to read values given by the sensor, on the computer!
We dipped the Grove Water Sensor in the same water salted solutions as the human experiment, 15 times (to have a good amount of data for our comparison and analysis) and we picked up the sensor’s values (values decreased as the salt concentration increased).

Here is an image showing basically our both experiments:


And below are the graphs we finally obtained: The first graph shows the percentages of errors in ordering the cups (for humans), in function of the salt concentrations; and the second graph shows the values given by the Grove Water Sensor for each cups.


As you can see, very few of our human cobayes did not place the cups in the correct concentration order. That is why we can observe random mistakes on the first graph. Also, as you can see, the error bars for the 2 cups filled with the concentration 3g/L are not the same: that meen that some of the humans did not recognise that these 2 cups were filled with the same salt solution.
The second graph shows, in contrary, that the Grove Water Sensor did make precisely the difference between less salted waters and higher salted water. Indeed, more the salt concentrations in the cups increased, lower were the values given by the sensor, on the computer. Also, this sensor did recognise twice the same 3g/L concentration (that is why there is only one dot for 3g/L on the second graph).


So what can we conclude? Well, both humans and the Grove Water Sensor can sense several salt concentrations in water. But the Grove Water Sensor can best make the difference between different concentrations. As it gave us more values compared to the humans, who only placed the cups in the right order, the Grove Water Sensor is more precise. But, the values given by the sensor are more dispersed (the second graph shows only the averages of the values, as we tested this sensor 15 times for each concentrations). So that makes the electronic sensor less accurate compared to humans.


It would be interesting and fun to repeat this experiment again with more cobayes, more solutions of different salt concentrations and more than 1 Grove Water Sensor. Maybe with more samples, humans will be able to beat the electronic sensor?!


Read this article! If you want to learn more about the link biology-electronics:


And this blogpost about the brain’s power using the tongue:

Salteam twitter : @SALTyeam


Our resources:
https://en.wikipedia.org/wiki/Pull-up_resistor

Blog disclaimer

The content created by the Learning thru research Student Bloggers and those providing comments are theirs alone, and do not reflect the opinions of Centre de recherche interdisciplinaire, University Paris Descartes or any employee thereof. The authors of posts and comments are responsible for the accuracy of any of the information supplied on this blog, as well as for any content copyright issues.