Showing posts with label light. Show all posts

January 23, 2017

How does light intensity influence photosynthesis in Egeria densa

During one week, we, students at the FDV Bachelor program, designed an interdisciplinary scientific project aiming at comparing a biological sensor with an electronic one. We decided to work with Egeria densa, an algae mostly used in aquarium and that releases a lot of oxygen (O2) while doing photosynthesis.

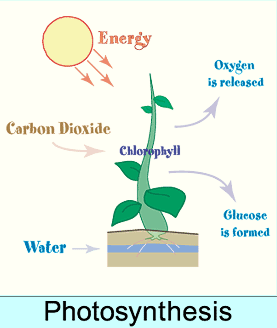
Image result for egeria densaPhotosynthesis is a process by which plants form glucose and release O2 using the energy from the sun, water and carbon dioxide (CO2). For more explanations about the photosynthesis process, you can have a look at this video.
In this project, we wanted to see if Egeria densa can be used to measure the intensity of light, regarding how much O2 is released by the algae while doing photosynthesis. We wanted to compare the range, accuracy and precision of the two different sensors. The accuracy of a sensor is how far is the measured value from the true value. The precision is how far are the measured values apart from one another. The range is the limits between which the sensor will be able to measure values.


First, we designed closed wood boxes with holes for the LEDs, in order to have a good control on light intensity exposure. It looked like this :
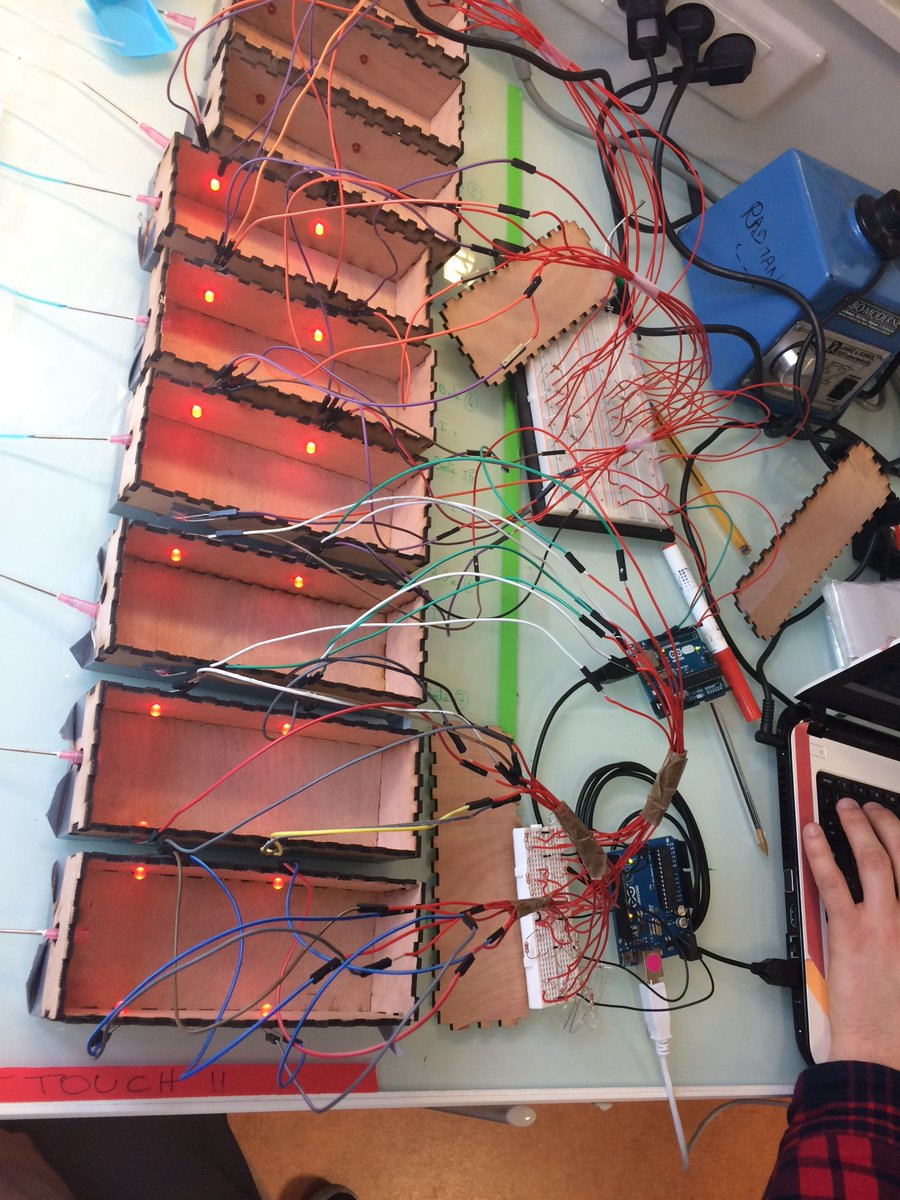

To do so, we create a protocol in which Egeria densa were put in a syringe with tap water, connected to a clear rubber tube full of ink. When O2 was released by the algae, the ink was moving out of the tube. We also build a device (a box) that blocks noisy emissions of light, and emits a red beam at a certain intensity. Thanks to that, we were able to measure how much O2 was released, and by consequence, to measure the impact of the LED intensity on photosynthesis.


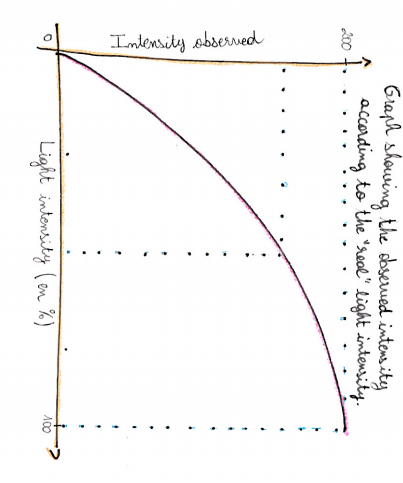
Here are the graphs we obtained :
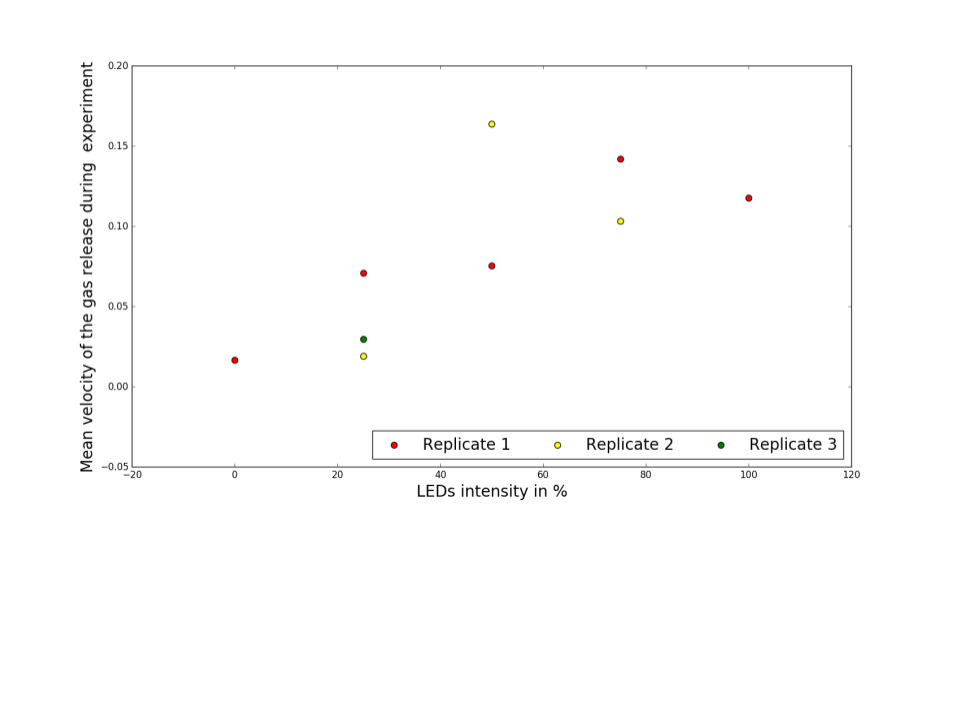

As we can see on those graphs, there are no obvious trend, even though we can draw some observations.
However, we can see that for the biological sensor, the negative control (0%) and the 25% intensity curves have kind of the same trend, therefore, we can think that the sensor doesn’t sense any changes between 0% and 25%. The same thing between the positive control (100%) and the 75% intensity curves. With those observations, we can say that probably, the range of the biological device is something like 25%-75%, where 75% is the saturation point.

The response time of the biological sensor, we can assume regarding our graphs that it takes approximately an hour for the sensor to have a constant value. This is explained by the fact that the algae has to adapt to the new LED intensity.
As for the response time of the electronic sensor, we measured it at 200ms. Indeed, we took measurements every 100 ms and only the third value was constant. Therefore, we had to wait for 2 values, meaning 100ms x 2 which equal to 200ms, our response time.

To conclude, we cannot really conclude with a statistical approach with the results we got.
Maybe one way to improve our experiment and to have more relevant results would be to use O2 probes, instead of the rubber tube. We could also design another box that is darker, and more easy to adapt and use for the large audience. It could become an interdisciplinary tool to understand that a sensor can be very surprising and innovative.

We also imagine using another organism, such as a bacteria that produces gas, or an enzyme.

For more informations about the ‘Photosynthetic strategies of Egeria densa”, please read this article.

Photosynthesis pictures is from : http://www.factmonster.com/ipka/A0775714.html

Here is our storify : https://t.co/gPgQCCfJzH 

Here is an identity card of our organism : Fiche - Egeria-Densa-Sr.pdf. Accessed January 20, 2017.
http://www.centrederessources-loirenature.com/mediatheque/especes_inva/fiches_FCBN/Fiche%20-%20egeria-densa-sr.pdf 

Thanks for reading ! See you soon !

January 25, 2016

Biosensors: focusing on sensing light


Week 1 of Biosensors course focused on examining how biological and electronic systems perceive light in their environment.

Students designed their projects in a way to try to compare specific characteristics of both biological and electronic sensor, by carefully designing the experimental setup, choosing the appropriate biological model organism as well as the creation of the electronic device.

Credits: Wikipedia page on lenses and optics

Comparing angular precision in Daphnia's and LDR's response to light

By Gaspard Baudrin, Manon Curaudeau, Xander Hampel and Isabelle Jousset - @AngulightFDV

Hello to you lovely people ! This blogpost is about a one-week experiment our team conducted during the Biosensors course, which consists of a wonderful month giving birth to a myriad of very diverse scientific group-projects about biosensors. It was organised by our interdisciplinary bachelor program “Frontiers of Life Sciences” hosted by the CRI!!!


Where the light shines, the shrimp goes!


Changes in light intensity are known to have a strong effect on Daphnia's behavior.
Like many species in the marine environment, Daphnia - a small planktonic crustacean - migrates to upper luminous water layers during the night and return to deeper layers during the day, before sunrise.

This behavior is due to their transparency: even though transparency protects Daphnia from being seen by their predators, it enhance the exposition of their molecular components (proteins, DNA) to solar irradiation. As a result, they react to UV light with negative phototaxis : they move away from the sunlight.

But Daphnia also perform positive phototaxis, which means they move towards sources of light. During the night, when the aggressive sunrays can't harm them, Daphnia return to surface seeking for their main source of food : photosynthetic phytoplankton. Phytoplankton floats near the surface for they need sunlight to accomplish photosynthesis. Daphnia use light from stars and moon as a trusted guide towards their food. All they need to do is swim upwards where the beaming, harmless moonlight spreads all over the ocean.


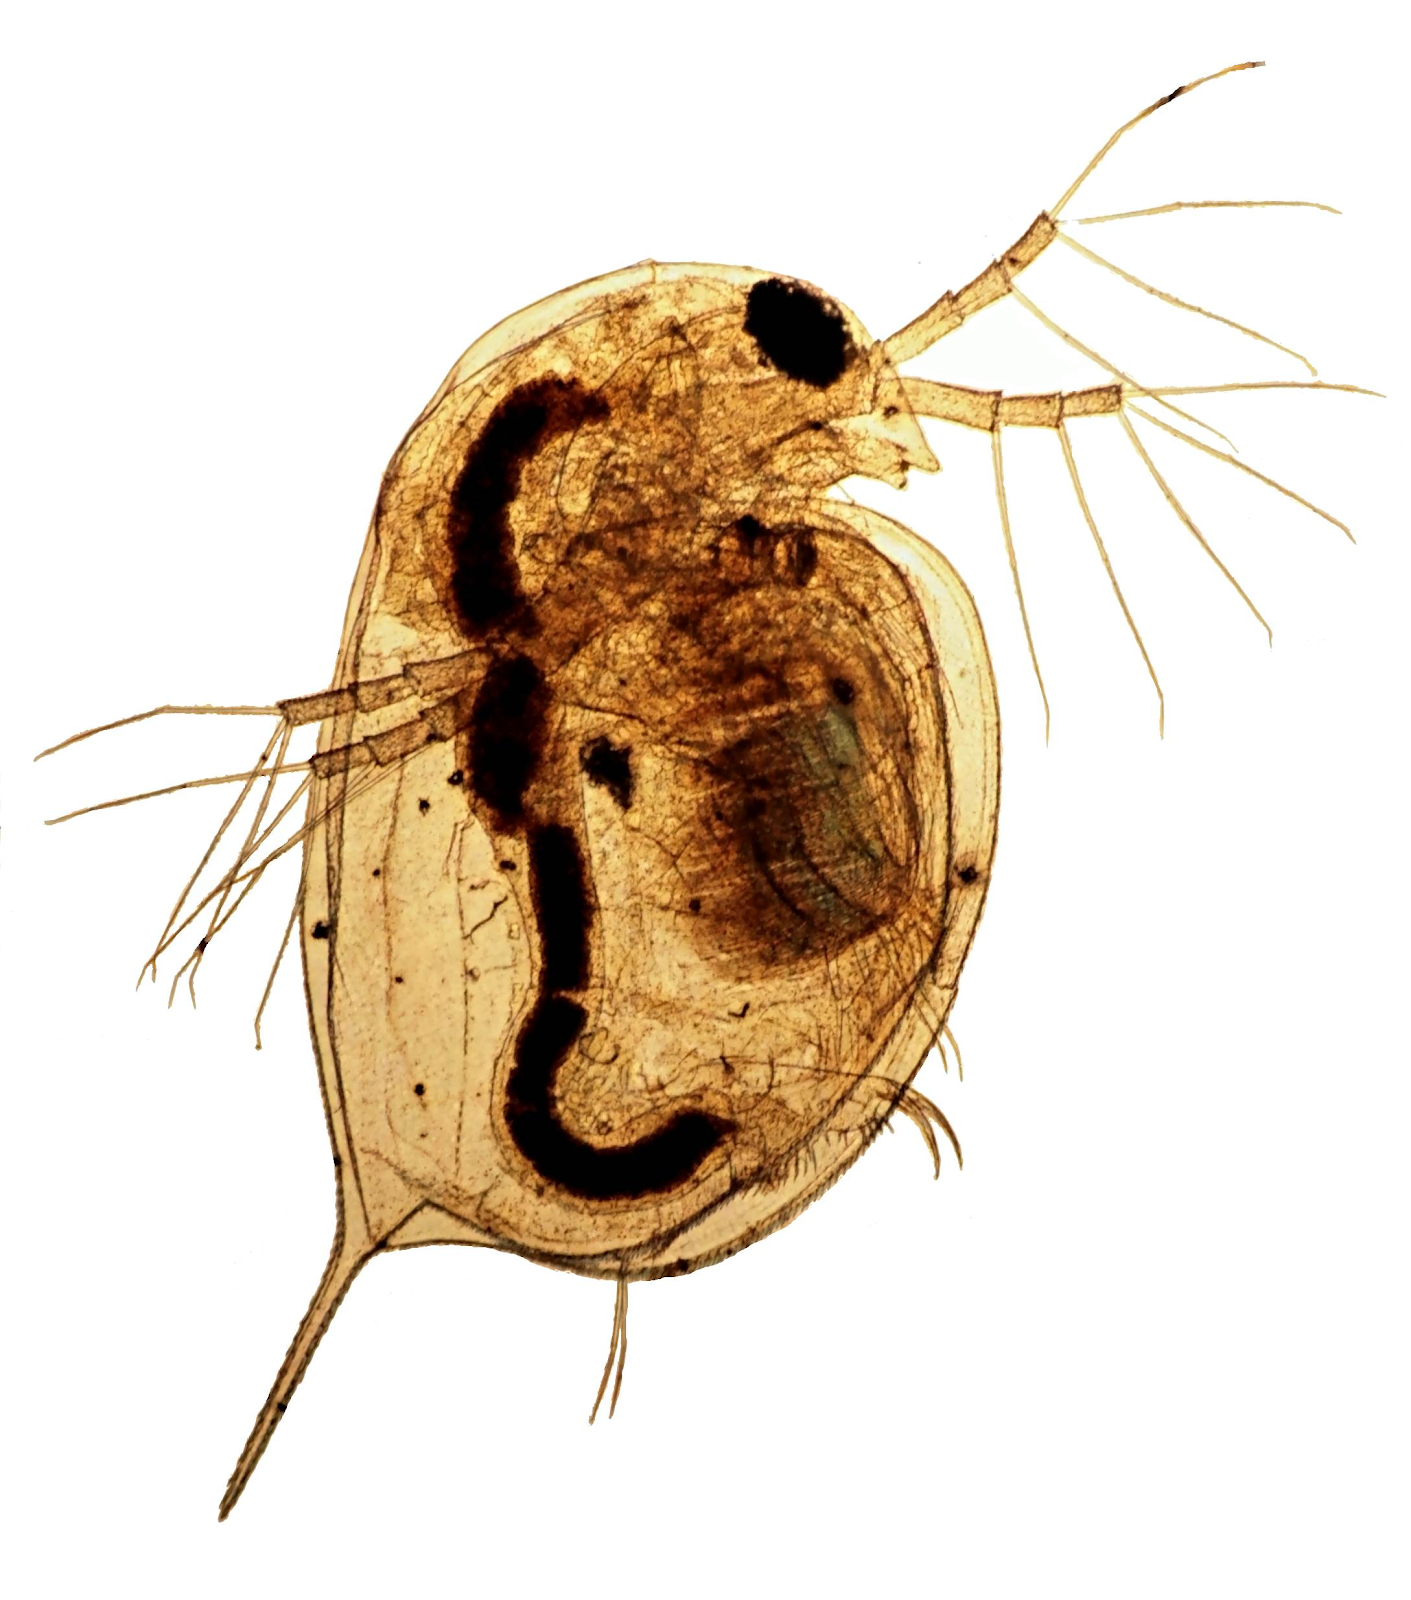
Fig 1 - Daphnia’s compound eye: It is made of thousands of photoreceptor units, and enable them to detect different light intensities. (credits to http://arthropoda.southernfriedscience.com/wp-content/uploads/2011/02/daphniaeye.jpg)


We were wondering how sharpened these receptors are, and therefore how precisely Daphnia can trend towards a located source of visible light. We decided to answer that question, or at least to get more insights about it, by comparing Daphnia and an electronic light sensor (LDR standing for Light Dependent Resistor). We focused on angular precision,

LDR is a light-controlled variable resistor, which means that its resistance varies with light intensity. Indeed, its resistance decreases when the light intensity increases. This features enables the device to detect light and measure the luminosity

So far, we supposed that the precision of both Daphnia and LDR will increase when the intensity rises. We assumed that the angular precision of the electronic sensor will overtake the precision of the Daphnia.

To investigate this, we ran two different experiments, a biological and an electronic one. We had six light intensity tested for both (including no light and maximal light we could produce with a white LED).
For the biological part, we first measured the average position of ten daphnia (disposed in a thin layer of water) at each of the six different values of intensity we exposed them to. Then we compared the resultant angular position with the value of the angle of the light source.
In the meantime, we tested the precision of the electronic sensor we’ve engineered in such a way that it takes measurements every 1° in 180° and gives us the angle of the highest perceived value of intensity.


Fig 2 - Our experimental setup:  We exposed both daphnia and a LDR (disposed on a movable arm) to six different light intensities. The light was produced by a LED that was disposed randomly but at a known angle (135°). Then we measured the angle between the source of light and the position of both Daphnia (their average position) and the LDR.


We expected the Daphnia to move towards the light, but they actually moved away from it. Anyway, we still could exploit our results : indeed, to avoid the light Daphnia have to go as far as possible from it. Their ability to do so still depends on the precision of their light-sensitive organs. Instead of moving towards the maximum of intensity they would move towards the minimum of intensity perceived. And where would the minimum of intensity be ? Well it would be at the farthest point of the position of the light source, which means at the exact opposite point !

Fig 3 - Data analysis for daphnia:  The average position of daphnia was calculated (cross) using ImageJ. The measured angle is between the light ray and the ray passing through the averaged position. It is the same wether the daphnia go to the light or if they escape from it.

Many studies have been conducted regarding the behavior of Daphnia when exposed to UV light, but little is known about the effect of visible light on marine zooplankton. Our results show that for Daphnia, an increase in light intensity goes along with a decrease in the measured angle. It means that the accuracy of daphnia photoreceptors increases. Our graph shows that a limit of accuracy of 10° is reached from 500 a.u.

Regarding the the electronic device, it seems that accuracy doesn’t depends on light intensity, but more measurements need to be done. Plus, the precision of the sensor depends mostly on the precision of the mobile arm.


Fig 4 - Our results: Angle in function of intensity for both tested devices.

Comparing the response of two different sensors to different light intensities appeared as the primordial aspect of our study. From our results, it appears that the LDR device is precise but not accurate, and that it’s accuracy does not depends on light intensity. As for daphnia’s accuracy, it depends on light intensity, and their photoreceptors are not super precise.


References:
Interaction of polarized light and turbidity in the orientation of Daphnia and Mysidium TH Waterman - Zeitschrift für vergleichende Physiologie, 1960 - Springer
Individual swimming behavior of Daphnia: effects of food, light and container size in four clones Stanley I. Dodson, Shanna Ryan,Ralph Tollrian and Winfried Lampert
Phototaxis in water fleas (Daphnia magna) is differently influenced by visible and UV light
U. C. Storz, R. J. Paul

Some physical factors influencing the feeding behavior of daphnia magna straus  J. W. McMahon

January 24, 2016

OpenFlowers

OpenFlowers

By Nicolas Silva, Clara Haas, Margaux Bieuville and Amélie Bouissou

The main goal of the biosensor weeks is to compare biological and electronical sensors. To do so we decided to use a phototransistor as an electronic sensor for light. For the biological sensor, our first idea was to study the opening of flowers depending on the intensity of luminosity. The flower with the most amazing movement reacting to light is the nympheas as you can see here: https://www.youtube.com/watch?v=dem8ZDXycR4. The Oxalis triangularis has also impressive leaf movement with variation of light: https://www.youtube.com/watch?v=7mSBTkKqqOU.
Sadly, we are in January so finding plants with flowers sensitive to different luminosities is not really easy.  

We therefore decided to change the scale of our experiment and study the movement of chloroplasts in cells at different light intensities. Chloroplasts are little compartments in plant cells that allow photosynthesis to happen, therefore they are sensitive to different types and intensities of light. When there is little or no intense light, the chloroplasts migrate to the surface of the cell to capture the most light in order to do photosynthesis. On the contrary when there is too much light the chloroplasts migrate against the side cell walls to avoid photodamage. You can read more about this phenomenon in this Nature article: “Chloroplast avoidance movement reduces photodamage in plants” http://www.nature.com/nature/journal/v420/n6917/full/nature01213.html 

We compared the reactions of a biological sensor in the form of chloroplasts and an electronic sensor, a phototransistor, in different light intensities.  We put leaf cells on a microscope slide and put them for 20 minutes under either maximum light, medium intensity light or dark.  Simultaneously, we were measuring this light intensity with the phototransistor, an electronic component connected to an Arduino board then to a computer.  We then observed the leaf cells under the microscope.  Since chloroplasts contain chlorophyll, a fluorescent pigment, we were able to distinguish the chloroplasts thanks to fluorescence microscopy.  We took pictures and counted how many chloroplasts were touching the side cell walls.  You can see our experimental protocol on the following image:

Visual protocol of our experiment and data analysis
 

    Our results were very interesting since they allowed us to evaluate the efficiency and precision of both sensors.  In the dark, 4 chloroplasts on average touch the side membranes whereas in medium intensity light approximately 8 chloroplasts are touching and in maximum light, 11 chloroplasts were touching on average.  Similarly to what we expected, we observed that the more light the leaf cells were exposed to, the more chloroplasts touched the side cell membranes, as if to avoid being in the center of the cell.  This matches the previous research done on the topic as you can read in the Nature article.  The phototransistor, the electric component, returned non-linear values, meaning that the value that it measured did not correspond to the intensity sent.  For the intensity measured in the dark or in full light, the values were pretty accurate but for medium intensities, the value measured was not proportional to the current sent.

    Through these two experiments, we learned that though chloroplast layout is a good indicator of light intensity, it is not very precise.  From one cell to another, the number of chloroplasts can vary and their response to light will not be identical.  The response time, meaning the time from initial light exposition to the reading of the result, is also very long since we have to prepare the leaf cell sample, expose it for 20 minutes, observe the cells on the microscope then count the number of chloroplasts.  On the other hand, the phototransistor is connected to a computer, and the measured value can be seen almost instantly.  However, the phototransistor is not fully reliable since there were several problems.

expMax_T1_0.1ms_fluo_5 bis.jpg

Plant cell magnification x63 with mRFP filter after 20 minutes exposition with maximum intensity light


References:

Kasahara, Masahiro et al. "Chloroplast Avoidance Movement Reduces Photodamage in Plants." Nature.com. Letters to Nature, 19 Dec. 2002. Web. 19 Jan. 2016.
Islam, Sayeedul, and Shingo Takagi. "." NCBI. Plant Signaling and Behavior, 5 Feb. 2010. Web. 19 Jan. 2016. Co-localization of Mitochondria with Chloroplasts Is a Light-dependent Reversible Response
Chloroplast Photorelocation Movement: A Sophisticated Strategy for Chloroplasts to Perform Efficient Photosynthesis, Noriyuki Suetsugu et al. (2012)
The Noun Project: https://thenounproject.com/

Which can best sense light: Daphnia or LDR sensor?

If you were in the middle of a tunnel and had to choose between going towards the lightened end and the dark end, what would you do?


Many organisms, such as animals and plants can sense light and are attracted to it. For example, you might have noticed that sunflowers turn towards the sun, during daytime, or that moths fly often near bright lanterns, at night. These organisms are called biological sensors.

Biological sensors are not the only elements that can sense light. You might have used once a lamp torch that charges with light and seen street lights turning on when it gets darks. These are examples of electronic sensors.


So which between biological and electronic sensors can best sense light?


Well, last week, with our bachelor interdisciplinary and scientific program, we developed projects in teams to compare biological and electronic light sensors. Our group decided to study Daphnia’s behaviour to light and compare it to the electronic LDR sensor, which is found in street lights, in some cameras and alarm clocks. So we tried to answer this question:

Which between the Daphnia and the LDR sensor is the most precise in distinguishing two lights of different intensities?


But what are exactly Daphnia?
Daphnia are small  crustaceans (1 to 3 mm) that live in stagnant freshwater ponds. We learnt that Daphnia are attracted by light, which explains why they migrate to the surface during daytime or full moons at night.
Here is a link to an interesting article to understand how Daphnia sense light:
And here is a link to a video which shows Daphnia attracted by light:


And what is precisely an LDR sensor?
As was stated previously, the LDR sensor is quite a common and low cost light sensor. What does it do? It simply detects light intensities. When the LDR sensor is plugged to an electrical circuit and to a computer, we can then read light intensities values given from the LDR sensor on the computer. These values are low when the sensor is in presence of no or low light and they are high when the sensor detects high light.


To answer our big question above, we performed series of experiments with our biological and electronic sensor.

We first created a device (electrical circuit) with two LEDs and  an LDR sensor. It allowed us to read on a computer and adjust the light intensity of each LED and to detect specific values of light intensities from the sensor.

We next installed our device in a dark room, and placed two LEDs on opposite sides of a clean lasagne dish, so we could play with the intensities of the two lights.
We could then observe the values given by the LDR sensor and Daphnia’s reaction to light by counting them on both sides of the dish, for different conditions:
  • with both LEDs off (negative control - 1 on image below)
  • with both LEDs on at their maximum (positive control - 2 on image below)
  • with one LED turned off while the second LED intensity is regularly increased (positive control - 3 on image below). We did this same experiment for both LEDs
  • with one LED turned at its maximum while the second LED intensity is regularly increased (Experiment - 4 on image below)

The results we expected for each of these conditions are presented also on the image below: the values given on both sides of the dish by the LDR sensor (in blue) and the distribution of Daphnia (in pink).
12596703_918108508286286_1567137455_o.jpg
We tested this with 4 batches of around 100 Daphnia and with 4 different LDR sensors, to be sure of the validity of our tests.


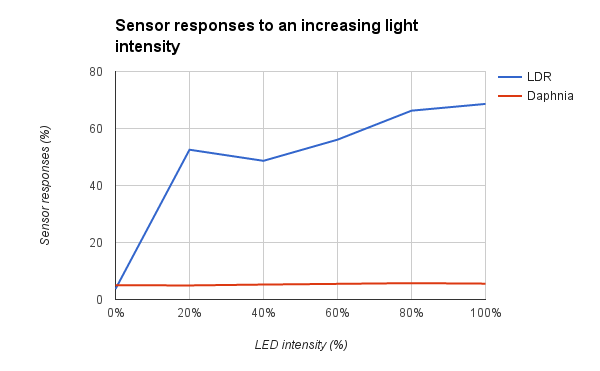
Here is a simple graph showing the results of our controls: it shows in percentage, the difference between the light intensities values on both sides of the dish, sensed by the LDR (blue) and the difference between the number of Daphnia (red) on both sides also, in function of the intensity of one LED (one LED turned off while the second LED intensity is regularly increased).
image(4).png
As you can see, higher is the intensity of the LED concerned, the more the LDR can sense it. But Daphnia did not seem to react to this variation of intensity. We noticed in fact that they would prefer repeal bright light.

Because controls revealed the indifference of our Daphnia to light, we can not compare the sensors reactions with one LED turned at its maximum and the second LED regularly increased. So we cannot answer our big question above and make solid conclusions. But we learned that as Daphnia, LDR sensor have important variability and that LDRs seem less affected by external factors compared to Daphnia (temperature, day and night cycle, see http://onlinelibrary.wiley.com/doi/10.4319/lo.1975.20.4.0564/pdf...).


Hanaé BRADSHAW
Cécile CRAPART
Lucile SZPIRO
Fairouz GZARA

References:

  • Cool Digital Photography, (2013). 31 Sunny Pictures of Sunflower. [online] Available at: http://cooldigital.photography/sunflower/ [Accessed 24 Jan. 2016].
  • Bio390parasitology.blogspot.fr, (2012). Themes of Parasitology. [online] Available at: http://bio390parasitology.blogspot.fr/2012/03/normal-0-false-false-false.html [Accessed 24 Jan. 2016].
  • Bbc.co.uk, (2016). BBC - Wonder Monkey: Like moths to a flame. [online] Available at: http://www.bbc.co.uk/blogs/wondermonkey/2011/05/like-moths-to-a-flame.shtml [Accessed 24 Jan. 2016].
  • IFLScience, (2014). Why Are Bugs Attracted To light?. [online] Available at: http://www.iflscience.com/plants-and-animals/why-are-bugs-attracted-light [Accessed 24 Jan. 2016].
  • HowStuffWorks, (2001). Why are moths attracted to light?. [online] Available at: http://animals.howstuffworks.com/insects/question675.htm [Accessed 24 Jan. 2016].
  • Freepik, (2016). Freepik | Free Graphic resources for everyone. [online] Available at: http://www.freepik.com [Accessed 24 Jan. 2016].
  • STEARNS, S. (1975). Light responses of Daphnia pulex. Limnol. Oceangr., 20(4), pp.564-570.
  • Smith, K. and Macagno, E. (1990). UV photoreceptors in the compound eye of Daphnia magna (Crustacea, Branchiopoda). A fourth spectral class in single ommatidia. J Comp Physiol A, 166(5).

Blog disclaimer

The content created by the Learning thru research Student Bloggers and those providing comments are theirs alone, and do not reflect the opinions of Centre de recherche interdisciplinaire, University Paris Descartes or any employee thereof. The authors of posts and comments are responsible for the accuracy of any of the information supplied on this blog, as well as for any content copyright issues.