Showing posts with label blogpost. Show all posts

September 20, 2016

A study on the color of Serratia Marscesens: Does the culture media has an influence?

How does nutrient media affect color variation in Serratia marscesens?


Serratia marscesens is a pathogen bacterium that can be found in hospital-acquired infections and that appears in some humans tracts. If you do not know about it, think that its color is so much alike the human red blood color that there is an old middle age legend that tells us that prodigiosin - the Serratia marscesens pigment - has been evoked as a naturalistic explanation of a miraculous appearance of blood on the Corporal of Bolsena, a consecrated host that was thought to be the blood of Christ!
Anyway, the metabolism and the functioning of this  bacterium is still quite unknown, and by studying prodigiosin’s role and activities we could find more informations about its importance in the microbe and therefore provide more basic knowledge to look for medical cures. In the study of it, we can change different parameters to look at its color variation. I decided to study the influence of nutrient media as it was easier to manipulate in the laboratory than other parameters (pH, Temperature…) and because if the results have significance, the research of nutrient media's influence on bacteria in a more general way could be applied in other researches!


Pictures: you can see there the reaction of prodigiosin on bread, and see how much does it look like blood! Then, a picture of a tapestry depicting the Miracle of Bolsena in a parade in Orvieto, Italy.


Looking for bibliography, I found there were already some researches that studied the effect of some nutrient media on prodigiosin color variation. They showed the red color tended to decrease in stressful conditions, which means that Serratia marscesens can show a wide range of colors going from light red to white!
I used a new nutrient media: PCA. This one is a normal nutrient media used to grow bacteria in the lab. I just decided to change the quantity of trypton - the main source of nutrients - and see how the colonies behaved after some time of incubation at an optimal growth temperature.
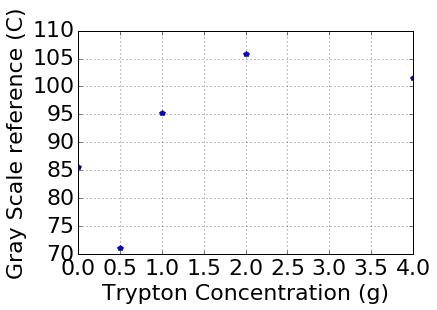


So here you can see my results. In the x-axis there are the different quantities of trypton I added in the different nutrient media (0g, 0.5g, 1g, 2g, 4g). In the y-axis there is the reference I used to study the color intensity of my colonies with a software called ImageJ. The more the values are high, the more the color get lighter! Starting from the O.5 g, that is the normal quantity of trypton in PCA, you can see that the more I add trypton the more the color values tend to increase, and so the color get lighter! Keep in mind that all the points are simple averages of all the data I collected for my replicates. What you can finally observe, is that the only point that does not follow this increasing pattern is the last one. I don’t have enough data to see if this behaviour will continue by adding more and more trypton, but it would be definitely worth studying it in further researches!


Finally, I can conclude with these results that Serratia Marscesens effectively do behave as other researches observed in their studies on other nutrient media effects on the microbe: in stressful condition of media, the color tends to decrease. Now, the experiment would need to be repeated more than once to see if - as my experiment has shown - the color of the bacterium does really start to get darker again at a certain quantity of trypton added. And if this is the case, try to find new hypothesis on why this phenomenon happen and then create new protocols and do new experiments to observe this color variation!

Sarah Talon Sampieri, student at Licence Frontières du Vivant, Université Paris Descartes.

This post is based on a project experience made in Petnica Science Center, for the program #labsprint


If you want to know more, here you are some pages and video:


February 15, 2016

Does Escherichia coli respond to a nutrient gradient ?


 @EColorRace

On this final Biosensor week, we focused on the very known model microorganism Escherichia coli, the bacteria who lives in the lower intestines of humans and mammals. This bacteria is largely used in microbiology as it is the simplest organism to study complex mechanisms. They have a flagella that allow them to move in order to reach food. Food of bacteria is actually all nutrients like sugar, alcohol or amino acids that they need to develop and make some colonies. Depending on the nutrients available, their growth can be affected. There exists many different strains of E.coli, and fluorescent ones particularly interest us. Fluorescence might be useful to distinguish two strains of bacteria by naked eyes, by observing colonies of different colors! They can be stained with a fluorescent dye, in order to produce fluorescent images through UV lamp. As we were very interested in motility, fluorescence and growth of this bacteria, our main question was :

Who between starving E. coli and satiated ones is more sensitive to a nutrient gradient ?


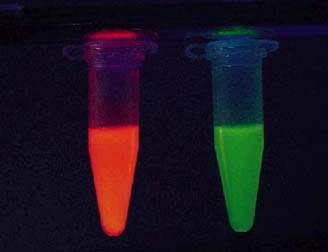
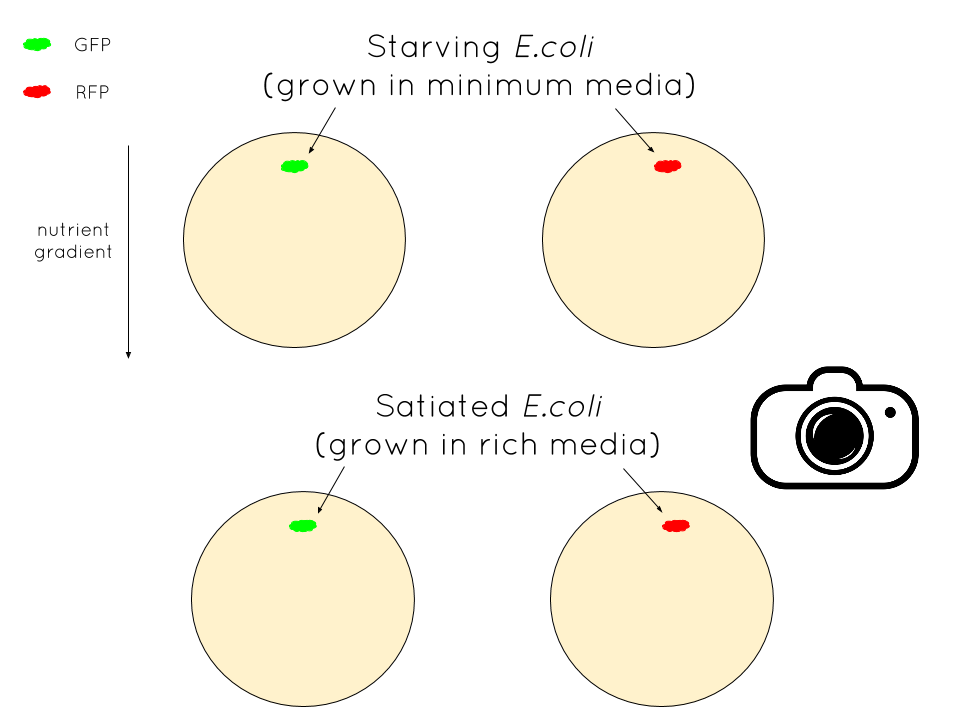
To answer this question we compared the speed of starving and satiated bacteria. We used two different strains, one marked with a green fluorescent protein (GFP, see how a nobel prize discovered it here!) and another marked with a red fluorescent protein (RFP). Starving bacteria are grown in a minimum media  for more than one night so that they have the nutrients strictly necessary to survive. Satiated bacteria are grown in a rich media with more nutrients than the absolutely necessary ones.
To produce the nutrient gradient through the petri dish  we tilled plates half full of media with food so that nutrients would be more concentrated on one side. Then we filled it with water and agar so bacteria can “swim” on it and look for food.                             Figure1. RFP and GFP
 
The experimental set-up consist in placing starving and satiated bacteria on the no food side of the plate and take picture for 24 hours of their moves toward food.
Who’s going to win the race?


Figure2. Experimental set-up
Dessin sans titre.png

To collect data, we designed an electronical device that takes photo every 10 minutes in order to see bacteria moving. Of course we could not take picture ourselves as their movement take a while and we should have stand for more than 12h in the lab ! To realize that device, we used a stepper motor. On the top of it we placed a huge plexi plate carve with cutter laser so that 2O petri dishes can stand without falling. This device permit the petri dishes to be  just under the camera for the time laps at a defined time.

Figure3. A new lab robot
But as it always happen in science, we had some troubles. The stepper motor was not strong enough to carry the plate and our bacteria in minimum media died…

We decided to estimate the response to a gradient of nutriment of a single strain of E. coli, the red ones, for three different times (bottom right side of Figure2). The times were 15h after putting the bacteria on the plate, 23h and 40h.  Our new problematic is indeed :

How RFP respond to a nutrient gradient over time ?

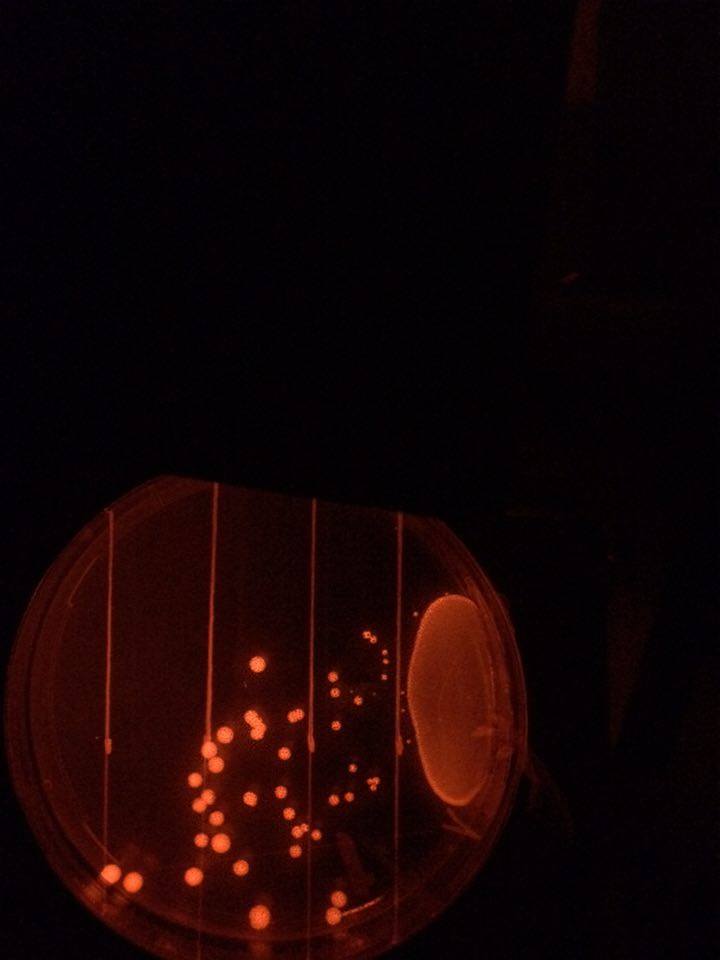
The protocol remain the same but the analysis is different. Instead of measuring speed we decided to focus on three parameters indicating a response to the gradient: the number of colonies formed, their size and the area they grew in. We divided each plate in five areas. One is where there is less nutrients and five correspond to the most concentrated region.

Dessin sanns titre.png

T1 = 15h            T2 = 23h        T3 = 40h
RFP1.jpgRFP1.JPGRFP3.jpg
Figure4. Our new analysis set-up


imbage.png
You can see on this graph that the number of colonies globally increases over time. More interesting, there are more and more colonies on the areas where nutrients are more concentrated, especially areas 2 and 3 but even 4 after more hours (23h). It means that some E. coli moved from their starting point to develop a colony in a more conducive environment to grow. To know more about bacteria moves, look at this video! image.png
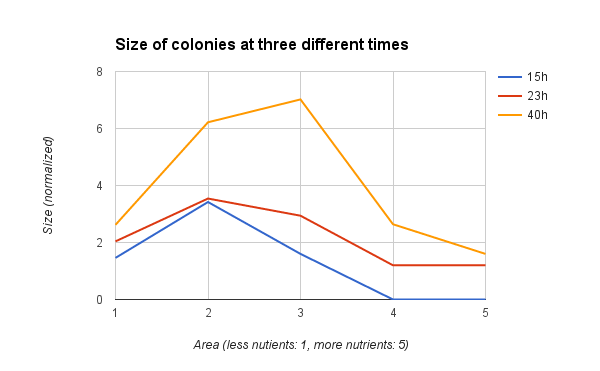
You can see on this second graph that the size of bacteria also globally increases over time (red curve above blue and orange curve above red). Furthermore, colonies seem to be bigger in areas with more nutrient (area 3) after a long period such as  40h (orange curve).

Regarding those results, we can conclude that bacteria respond to a nutrient gradient through time and actually feel it. We also observe that when there is enough food in the area, they stop moving and form bigger colonies beside going farther toward food. But we can expect that after a long period, number and size of colonies will be maximum in area 5.
Thus, we proved that bacteria feel a gradient of food and go through it!
You can read this scientific article (1) to know more about how motile bacteria grow on heterogeneous surface.

We now have to do this experiment again with starving bacteria to answer our first question. But a perspective would be to study interactions between the two considered strains and organize a rate between them. This time they are on the same plate and competed for food. This experiment should demonstrate that E.coli interact and so have a group effect on each other.


Reference:
  • Koster, D., Mayo, A., Bren, A. and Alon, U. (2012). Surface Growth of a Motile Bacterial Population Resembles Growth in a Chemostat. Journal of Molecular Biology, 424(3-4), pp.180-191.
  • Pubs.acs.org, (2016). A Simple Method for GFP- and RFP-based Dual Color Single-Molecule Localization Microscopy - ACS Chemical Biology (ACS Publications). [online] Available at: http://pubs.acs.org/doi/abs/10.1021/acschembio.5b00046 [Accessed 12 Feb. 2016].
  • Kearns, D. (2010). A field guide to bacterial swarming motility. Nature Reviews Microbiology, 8(9), pp.634-644.

You can follow us on twitter:   https://twitter.com/EColorRace?lang=fr


Blog disclaimer

The content created by the Learning thru research Student Bloggers and those providing comments are theirs alone, and do not reflect the opinions of Centre de recherche interdisciplinaire, University Paris Descartes or any employee thereof. The authors of posts and comments are responsible for the accuracy of any of the information supplied on this blog, as well as for any content copyright issues.