February 26, 2017

Sugar DaddYeast, Or Sensing Sugar With Yeast

Sugar DaddYeast
Or sensing sugar with Yeast


Yeast… yeast are wonderful organisms. It’s fascinating how human used these microorganisms. From ancient history to nowadays, humanity used it for many purposes, especially for bread, wine and beer, which participated in human development. Humanity has used for a long time the incredible ability of yeast to transform sugar into alcohol.
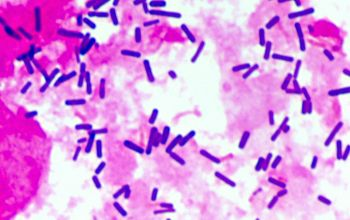
In this project, we want to use Saccharomyces cerevisiae (also known as baker’s yeast) as a sugar sensor. We can observe its reaction in two ways, that are induced by different sugar concentrations in their media where it develops.


First because they “eat” sugar in their environment, to do cellular respiration or alcoholic fermentation. To check out these two types of metabolism, just look at this quick video here and here (you’ll even know how to do your own cider!). Basically, they will produce more waste of these metabolisms if more sugar is available to “eat” (just like us humans, if you understand what I mean…).


Second, because they react to higher concentrations of sugar in their environment in a specific way. Indeed, to survive “hyperosmotic pressure”, the phenomenon induced by higher concentrations of a solute in the surroundings of the organism than in the organism itself, they react by producing certain molecules, such as glycerol. If you did not understand well this phenomenon, watch this video or this one- it’s quite long but you’ll know a lot of interesting stuff (that’s the core of our variable, so yeah, that’s important to understand if you want to redo the project !).


At first we wanted to measure the quantity of alcohol (the output of alcoholic fermentation) produced, but we decided that it was way too difficult to measure, as well as CO2, the output of cellular respiration.
So we searched a way to spot the reaction of the cells to hyperosmotic pressure.


And we found a yeast’s protein, called HOG1. Proteins are the basis of every living form. They are coded by genes. Every gene codes for one protein. Now that’s very basic, if you want to know more about proteins and genes, you should think about following a molecular biology course. Or check out this video for an introduction.
This protein relocates from the cytoplasm into the nucleus of the yeast when the yeast is under hyperosmotic pressure.


We used a Green Fluorescent Protein (GFP) modified strain of yeast to spot the relocation of this protein, HOG1.
GFP-modified strains of yeast are GMOs. It means that their genetic information has been changed. Basically, bio-engineers will insert a gene coding for a fluorescent (which means, basically, that it glows back when exposed to a certain light) protein just next to a gene of interest -here, the gene coding for HOG1. We can observe a specific protein glowing with a fluorescence microscope, at a specific location of the cell.


Our protocol was simple : we would mix 10µL of yeast media (YPD) with a certain concentration of glucose with 10µL of an overnight culture of a GFP-HOG1 yeast strain. Then, we would put 3µL of the mix on a microscope slide, and observe this mix at the fluorescence microscope in less than 5 minutes. We would take several pictures (10-20), and we would count the number of cells, for each slide, that have fluorescence clearly and obviously more in the nucleus than in the cytoplasm, and the other.


Then, from this counting of cells, we would get a percentage. Here are our results, simplified for you to understand faster :


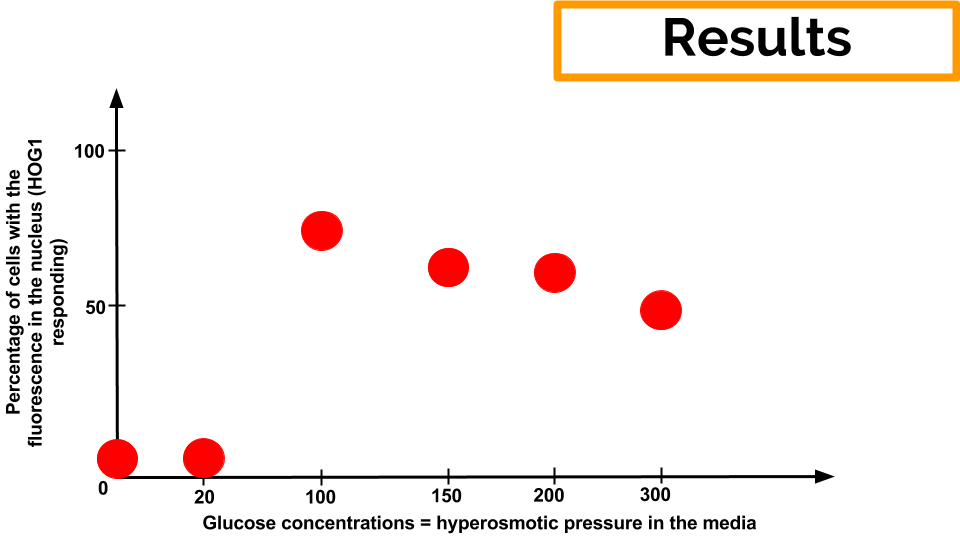
What can we conclude about that ? Not much. First, we don’t have enough data to be statistically relevant. Moreover, we have many experimental errors in our protocol. Did you find them all ?


First, we have a subjective classification of the cells that fluoresce in the nucleus and ones that fluoresce in the cytoplasm.
With a computer script to automatically treat the picture, we would have fewer variations in our measures.


Even though we have lots of experimental errors and confirmation biases (to know what it is, go there), we can observe from our results that hyperosmotic pressure does have an impact on the relocation of HOG1 in the nucleus, from 10% of glucose in the media. It’s also the concentration with the more response of the yeast cells. We observe a decrease of the response in higher concentrations, which may be due to the harsh conditions of such osmotic pressures that would kill the cells.


Further experiments should be performed, with less errors and biases, and more repetitions. The goal would be to understand if a HOG1-GFP strain of Saccharomyces cerevisiae can be used as a really accurate, precise and with a good resolution hyperosmotic pressure sensor!


Thanks a lot for reading our blog post, we hope you understood it. Don’t hesitate to contact us if you have any question, by email or twitter!


@leonfaurefdv
@louise_jacquot
@NinaVarcha

Link to the Storify : https://twitter.com/sugar_daddyeast/status/835847597235585024
Link to the GitHub documentation : https://github.com/learningthruresearch/Biosensors2017/tree/master/SugarDaddYeast

Image sources : fr.wikimedia.org
Lactobacillus acidophilus and acid detection !

Did you know that our stomach is an acid environment ? The pH (which is the unit that measures the acidity) is low. Very low. Its pH is equal at 2 on a scale that goes from 0 to 14. 0 being the most acid value. If you put your hand in this kind of environment, your cells would probably die quickly. However, some bacteria survive in our stomach (if you want to know more : click here)  Furthermore, they help the stomach to digest some nutriments. Without lactobacillus bacteria, we can’t digest sugar milk for instance. Lactobacillus changes the sugar from the milk in lactic acids which is used to form lactate. Lactobacillus acidophilus is very helpful for humans in different ways, as explained in this video (Xin Yun channel). Most interesting fact about this bacteria is that they are particularly adapted to survive in low pH. Why ? Because, they have a sensor which is activate in low pH. This sensor, situated in the membrane of the bacteria, active a system which adapt the internal pH of the bacteria according to the external pH. This point avoid cell damage. Moreover, this system ask energy. Thus, the production of lactic acid increase because the bacteria produce energy. So, we decided to observe the amount of lactic acid produced by Lactobacillus acidophilus according to the external pH.     1


How can we evaluate the amount of lactic acid ?
First, we prepare an environment where our bacteria can live. As we said before, this bacteria need sugar milk to form lactic acid. But they also live in an environment without oxygen. They practice fermentation. Thus, we prepare a medium with tomato juice (which have all the nutriment and allow fermentation) and milk.


*
Next, we fill three different Erlenmeyer with the same quantity of tomato juice.
We change the pH of each Erlenmeyer in order to get 3 different pH. We chose 5.2, 4.3, 3.1. Why ? 5.2 is the optimum pH for the bacteria. 4.3 is a pH tested in a previous research and 3 is a random pH.
After that, we added lactobacillus acidophilus in the three Erlenmeyer and after one night, we measured the pH. If, we observe a pH variation that would means that our bacteria produce lactic acids. We expect that lower is the pH higher is the production of lactic acid or the pH variation.
However, we could not assume that the change of pH is due to the production of lactic acid by the bacteria and not because of natural phenomenons or other reasons. Then, we needed to correlate the evolution of the amount of bacteria in each solution to the pH observed. This would allow us to make a link between the amount of bacteria and the pH of the solution, and then begin to confirm our basic hypothesis : the pH change (or not) is due to the production of lactic acid by Lactobacillus acidophilus.
Then, we took 3 others recipients in which we regulated the pH as the 3 others but we did not put any bacteria in it. We measured their pH at the same time than the 3 others.


In order to measure the pH, we used a pH-meter which is a device that you put inside a solution and it gives on a screen the pH measured. The disadvantage of these devices is their precision and accuracy. To minimize the errors of measurement, we repeated the measure of pH 3 times for each measure.


On the other hand, to estimate the amount of bacteria in each recipient, we took some samples that we put in a spectrophotometer (a device that gives the opacity of a solution by measuring the light that can goes through it) during a whole night until the measures of pH. This value of opacity (called optical density) along time gives us informations about the speed of the bacteria divisions and then the amount of them.

For the first solution at pH=5.2, we observed a decrease of the pH of 0.2 unit. For the other solutions there is no significant pH variation between the solutions with and without cell which make impossible to conclude on any implication of L. acidophilus in pH change. Eventually, all the measurements taken are not precise enough and the incubation time is not long enough to let  L. acidophilus produce enough acid that would have a significant impact.

Here is our github gathering all the files you will need to do this experiment !

And go have a look to our Storify

If you want to know us better, you can visit our twitter accounts here : 
Leonie, Adrien, Clément, and our project account : Dictyonique project 

Deflagellation and regeneration : When green algae becomes a mystery…


If you ever took samples from a stagnant water and tried to observe the microscopic world swarming inside, you probably encountered Chlamydomonas. They are very common unicellular algae, mostly known for being a good case of study for flagellar motility.
Here you can view a video showing some little Chlamydomonas and Euglena.

As you might have seen on the video, Chlamydomonas have a pair of flagella, tubes extruding from the cell body, allowing them to move. More surprisingly, Chlamydomonas are able to lose their flagella, a process named deflagellation, and regenerate them during what is called the flagellar regeneration in less than two hours !
These processes are observed under specific conditions : When Chlamydomonas are placed under stressful conditions, such as high temperatures, unbearable salinity or acidity of their environment, complex pathways of molecules and proteins are activated and lead to the loss of flagella. When Chlamydomonas are reintroduced in normal conditions, the regeneration starts.
Keep in mind that these processes are far away from a complete comprehension and people are still studying about them. Our project was inspired by online protocols from different Universities. You can access one of these through this link. We saw that deflagellation is usually done by the mean of a pH shock (a sudden variation of the environment’s acidity) and we wanted to pursue in this way, experimenting on the stress induced by the acidity of the environment. Therefore the main question of our experiment was : Down to what pH Chlamydomonas can keep their flagella ?

We wanted to see which value of acidity will trigger the loss of flagella for Chlamydomonas.
For that, we decided to add different amounts of acetic acid to modify the pH of the environment.
Here is a visual representation of our experiment (Figure 1 & 2) :
Schema Flagelloshock.png
Figure 1 : Schematic of the first part of our experiment : the Preparation
Step 1 : We made 3 samples of 400µL from our Chlamydomonas culture. Each sample will be exposed to a different value of acidic shock.
Step 2 : Different volumes from a solution of acetic acid were added to each sample.
Step 3 : We waited for 1 minute, letting the time for Chlamydomonas to lose their flagella.
Step 4 : Finally, we checked the acidity of the obtained solutions with pH paper. Just to be sure that the pH shock occurred.  One drop of the solution is enough to color the paper depending on the pH.

Schema FlagelloShock3.png
Figure 2 : Schematic of the second part of our experiment : the Observation
Step 5 : Immediately after the 1 minute waiting for the pH shock, the samples of Chlamydomonas were fixed in a Lugol solution. This solution kills and stains all the cells, allowing us to better observe them.
Step 6 : 5 µL of the solution were put on microscopic slides for later observation. We also placed a coverslip on the top.
Step 7 : We observed Chlamydomonas under a fluorescence microscope at x630 magnification and we counted the flagellated and deflagellated Chlamydomonas on each slides.
The  observations were made manually : it means that, we looked at the sample under the microscope, swept along, and noted down every deflagellated and flagellated Chlamydomonas. Image analysis and programming could help for further experimentations by counting more rapidly. Obvious observation biases come with this protocol. Indeed, due to imprecisions for some Chlamydomonas, we were not able to determine if they were flagellated or deflagellated without any doubt. However it allows us to make some statistics and graphs, and be able to compare the influence of acidic shock on Chlamydomonas (Figure 3) :
Capture d'écran 2017-02-23 06.03.02.png
Figure 3 : The average proportion of flagellated Chlamydomonas made with 3 measurements for each experiment. We made 3 repetitions of our experiment for each pH shock value.

The proportion of Chlamydomonas with flagella has been represented (figure 3) according to the pH. A slight tendency is visible : the number of flagellated Chlamydomonas is more important at pH 7. However, between pH 4 and 5.5, our results don’t allow use to conclude to a clear influence of a more acid medium to Chlamydomonas deflagellation.

But what are the advantages of losing their mobility’s structure only for reconstructing them afterwards ? Particular elements on these filaments allow Chlamydomonas to encounter and fix with potential mates for sexual reproduction. Living organisms put a lot of effort in reproduction and in granting good chances of survival for their progeny. Knowing that, we made an assumption : What if this behaviour was selected through evolution, seeing deflagellation as a mechanism disabling reproduction between Chlamydomonas during hard times ? Chlamydomonas able to lose their flagella would not waste their energy for uncertain reproduction compared to those who will reproduce anyway. The offspring of the “patient” Chlamydomonas would proliferate more because introduced in favorable conditions and thus more competitive.

If you want to know more about our precise protocol, data, coding elements, go on our GitHub page. During all our one week project, we also used Tweeter to inform people about our updates of the day. We made this storify to resume our adventure !
Hope you will like it and start your own ;)

© Julie Le Bot, Lina Vigneron, Nikola Zarevski

DARK SLIME MOLD FLEES FROM LIGHT!

DARK SLIME MOLD

    The slime mold Physarum polycephalum(literally meaning: the many-headed slime) is a lover of darkness. It tends to avoid light and to grow in moisture and humidity. It’s bright yellow color makes it particularly interesting to look at, and it’s ability to grow in short time periods is convenient in labs for studying protists and other slime molds. After learning a bit about the organism and it’s photophobia, we wondered how photophobic the slime mould would be if we lit it up several times with different light intensities; so we designed an experiment to do just that!

The experiment
To begin, we built a large box that had 16 compartments in it, each large enough to hold a Petri dish. It was made using a laser cutter, glue, patafix, and silver duct tape.

After this, we prepared our Petri dishes with Agar and water, as well oats at the center. We then placed one oat covered with slime mould in the center of each dish, then used the duct tape to cover half of each plate before placing them in the box.

We then passed an LED through the top of each compartment to light the plates.
Using an arduino, we set the brightness at which each LED would be powered and also built temperature and light sensors to make sure the conditions didn’t change to much inside the box.

We had 9 plates lit with 3 different intensities, as well as six plates without tape that were either kept in complete darkness or lit at maximum intensity. A final plate was kept just to cultivate the mold.


We expected to see that P. polycephalum would grow and cover a larger portion of the dark side of each plate(under the tape), rather than the portions that were lit by a LED.

Data and data … We analysed them in many way, look!   
After one day of growth, we opened the box to make sure that growth had truly taken place and our observations were encouraging, the organism had moderately grown, so we decided to leave our plates another 24 hours of growth. So that’s after more 44 hours of growth that we opened the whole box and took pictures of the plates. Then we measured the area occupied by the organism on each side of the plat (the side that was in the dark and the one that was illuminated).

We compared surface

    Once we finally uncovered our boxes, untaped them and took pictures of them, we used the software Image J to see the surface that our slime had covered. Our data didn’t show any clear trend, perhaps we should have the experiment more times. However, at our maximum intensity, the slime mold did seem to flee from the light more than previously, except in one case.

Then we calculated branches

    When we actually looked at the plates, we thought that the mold that had grown in the light seemed to be less dense and have less branches, which led us to count the branches on each side of every plate. This turned out to be difficult and unreliable because the quality of our photos was limited.

Finally we calculated fractal dimension


To avoid this difficulty, we decided to calculate the fractal dimension of the P. polycephalum that had grown in the light and under the tape with the same software imagej. To do this, we had to convert the images we had taken to an 8-bit image(in black and white), and then to a binary image, where everything is either entirely black or entirely white.

With the results we built those graphs that show the fractal dimension for the dark place and the the place lit up..


We found a fractal dimension for each value that hardly changed, and as you can see, there are no clear difference between the mold under the tape (in green on the graphs) and under the light (in yellow on the graphs). This meant we could not discover anything about the shape and growth of the mold. They seem to be the same under the light and under the tape.

    In contrary that we found in the literature we did not see a difference of growth of the  P. polycephalum in the dark or in the light. One of the reason we did not find like the scientific paper can be some problem of our experiment. The quantity of organism we put on the plates was not the same in each plate. Also the limit of the experiment was the lack. But thanks to the measures of the arduino sensors (Temperature and luminosity) we can say that this two parameters did not change and did not disturb the  P. polycephalum growth.

If you want to know more check this out :

OUr gitHub: https://github.com/learningthruresearch/Biosensors2017/tree/master/fisarumo

Our Storify: https://storify.com/azpiration/biosensors-final-project


    • Starostzik et al. “A Photoreceptor with Characteristics of Phytochrome Triggers Sporulation in the True Slime Mould Physarum Polycephalum.” FEBS Letters 370, no. 1–2 (1995): 146–48.
    • Ueda et al. “ACTION SPECTRA FOR SUPEROXIDE GENERATION AND UV AND VISIBLE LIGHT PHOTOAVOIDANCE IN PLASMODIA OF Physarum Polycephalum.” Photochemistry and Photobiology 48, no. 5 (1988): 705–9.
    • Hato et al. “Phototaxis in True Slime Mold Physarum Polycephalum.” Cell Structure and Function 1, no. 3 (1976): 269–78.
    • Purschwitz et al. “Seeing the Rainbow: Light Sensing in Fungi.” Current Opinion in Microbiology, Growth and devlopment, 9, no. 6 (2006): 566–71.
    • Kakiuchi et al. “Light Irradiation Induces Fragmentation of the Plasmodium, a Novel Photomorphogenesis in the True Slime Mold Physarum Polycephalum: Action Spectra and Evidence for Involvement of the Phytochrome¶.” Photochemistry and Photobiology 73, no. 3 (2001): 324.
    • Starostzik. “A Photoreceptor with Characteristics of Phytochrome Triggers Sporulation in the True Slime Mould Physarum Polycephalum.” FEBS Letters 370, no. 1–2 (August 14, 1995): 146–48.
    • Deep Look. This Pulsating Slime Mold Comes in Peace (Ft. It’s Okay to Be Smart) | Deep Look, 2016. https://www.youtube.com/watch?v=Nx3Uu1hfl6Q.
    • BioFilmer86. Physarum Polycephalum Eating Wild Fungus, 2012. https://www.youtube.com/watch?v=CqkISTDtDJI.
    • “Light Sensor (TSL2561).” Accessed February 6, 2017. http://fritzing.org/projects/arduino-light-sensor-tsl2561

Blog disclaimer

The content created by the Learning thru research Student Bloggers and those providing comments are theirs alone, and do not reflect the opinions of Centre de recherche interdisciplinaire, University Paris Descartes or any employee thereof. The authors of posts and comments are responsible for the accuracy of any of the information supplied on this blog, as well as for any content copyright issues.