@EColorRace
On this final Biosensor week, we focused on the very known model microorganism Escherichia coli, the bacteria who lives in the lower intestines of humans and mammals. This bacteria is largely used in microbiology as it is the simplest organism to study complex mechanisms. They have a flagella that allow them to move in order to reach food. Food of bacteria is actually all nutrients like sugar, alcohol or amino acids that they need to develop and make some colonies. Depending on the nutrients available, their growth can be affected. There exists many different strains of E.coli, and fluorescent ones particularly interest us. Fluorescence might be useful to distinguish two strains of bacteria by naked eyes, by observing colonies of different colors! They can be stained with a fluorescent dye, in order to produce fluorescent images through UV lamp. As we were very interested in motility, fluorescence and growth of this bacteria, our main question was :
Who between starving E. coli and satiated ones is more sensitive to a nutrient gradient ?
To answer this question we compared the speed of starving and satiated bacteria. We used two different strains, one marked with a green fluorescent protein (GFP, see how a nobel prize discovered it here!) and another marked with a red fluorescent protein (RFP). Starving bacteria are grown in a minimum media for more than one night so that they have the nutrients strictly necessary to survive. Satiated bacteria are grown in a rich media with more nutrients than the absolutely necessary ones.
To produce the nutrient gradient through the petri dish we tilled plates half full of media with food so that nutrients would be more concentrated on one side. Then we filled it with water and agar so bacteria can “swim” on it and look for food. Figure1. RFP and GFP
The experimental set-up consist in placing starving and satiated bacteria on the no food side of the plate and take picture for 24 hours of their moves toward food.
Who’s going to win the race?
Figure2. Experimental set-up
To collect data, we designed an electronical device that takes photo every 10 minutes in order to see bacteria moving. Of course we could not take picture ourselves as their movement take a while and we should have stand for more than 12h in the lab ! To realize that device, we used a stepper motor. On the top of it we placed a huge plexi plate carve with cutter laser so that 2O petri dishes can stand without falling. This device permit the petri dishes to be just under the camera for the time laps at a defined time.
Figure3. A new lab robot
But as it always happen in science, we had some troubles. The stepper motor was not strong enough to carry the plate and our bacteria in minimum media died…
We decided to estimate the response to a gradient of nutriment of a single strain of E. coli, the red ones, for three different times (bottom right side of Figure2). The times were 15h after putting the bacteria on the plate, 23h and 40h. Our new problematic is indeed :
How RFP respond to a nutrient gradient over time ?
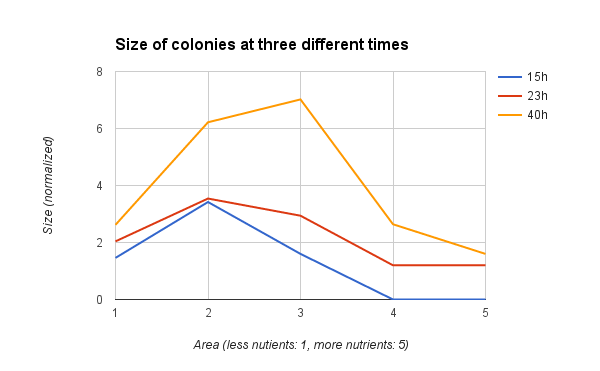
The protocol remain the same but the analysis is different. Instead of measuring speed we decided to focus on three parameters indicating a response to the gradient: the number of colonies formed, their size and the area they grew in. We divided each plate in five areas. One is where there is less nutrients and five correspond to the most concentrated region.
T1 = 15h T2 = 23h T3 = 40h
Figure4. Our new analysis set-up
You can see on this graph that the number of colonies globally increases over time. More interesting, there are more and more colonies on the areas where nutrients are more concentrated, especially areas 2 and 3 but even 4 after more hours (23h). It means that some E. coli moved from their starting point to develop a colony in a more conducive environment to grow. To know more about bacteria moves, look at this video! 
You can see on this second graph that the size of bacteria also globally increases over time (red curve above blue and orange curve above red). Furthermore, colonies seem to be bigger in areas with more nutrient (area 3) after a long period such as 40h (orange curve).
Regarding those results, we can conclude that bacteria respond to a nutrient gradient through time and actually feel it. We also observe that when there is enough food in the area, they stop moving and form bigger colonies beside going farther toward food. But we can expect that after a long period, number and size of colonies will be maximum in area 5.
Thus, we proved that bacteria feel a gradient of food and go through it!
You can read this scientific article (1) to know more about how motile bacteria grow on heterogeneous surface.
We now have to do this experiment again with starving bacteria to answer our first question. But a perspective would be to study interactions between the two considered strains and organize a rate between them. This time they are on the same plate and competed for food. This experiment should demonstrate that E.coli interact and so have a group effect on each other.
Reference:
- Koster, D., Mayo, A., Bren, A. and Alon, U. (2012). Surface Growth of a Motile Bacterial Population Resembles Growth in a Chemostat. Journal of Molecular Biology, 424(3-4), pp.180-191.
- Pubs.acs.org, (2016). A Simple Method for GFP- and RFP-based Dual Color Single-Molecule Localization Microscopy - ACS Chemical Biology (ACS Publications). [online] Available at: http://pubs.acs.org/doi/abs/10.1021/acschembio.5b00046 [Accessed 12 Feb. 2016].
- Kearns, D. (2010). A field guide to bacterial swarming motility. Nature Reviews Microbiology, 8(9), pp.634-644.
You can follow us on twitter: https://twitter.com/EColorRace?lang=fr

No comments:
Post a Comment