
Let’s talk chemistry !
Do you know what a gradient is? A gradient of salt is a progressive difference of salt concentrations in a liquid solution. When there is a large amount of sodium chloride in an organism’s environment, the difference in concentration between the outside and the inside of the organism is also very important. Whether in biology, physics or chemistry, unstable systems have a tendency to return to an equilibrium state. In this case, the water inside the cell would like to move out of the cell to reach a steady state by a phenomenon called osmosis, because of the large concentration difference. This “tendency to move” is called osmotic pressure. This week we will compare the responses of a water sensor and a modified bacteria to osmotic stress. We originally wanted to use Spirulina, a filamentous algae, but we gave up due to time and quantity concerns: it grows slowly and is very small, so difficult to quantify on two scales. We decided to focus on E.coli bacteria, since it is often used as a model organism in microbiology. Which between pProV E.coli bacteria and a water sensor has a higher sensitivity to different concentrations of salt?
Our E.coli is a modified strain, which contains a pProV gene on its genome: this gene is expressed when the bacteria perceives osmotic stress. The gene is linked to a Green Fluorescent Protein (GFP) gene that produces a fluorescent protein that can be detected with microscopy or spectroscopy. Each time the pProV gene is expressed, a GFP is subsequently produced. The water sensor is originally use to measure humidity but we use its to know the conductivity of a water solution because a reaction happens between molecules in water and it can be measured by the sensor.
The first step was to create different culture media. The original LB medium has a concentration of 5 g/L that we used as a positive control. We diluted sodium chloride (salt) in the normal LB in order to have 6, 7, 8, 9 and 10 g/L concentrations. We inoculated the media with pProv E.coli three different times to have biological triplicates and let the bacteria grow in the incubator at 37°C for 4 hours. We then kept only the grown bacteria and removed the LB by centrifugation and added PBS, a clear liquid that keeps the cells alive while reducing the noise measured. We used a TECAN spectrophotometer to measure the absorbance and fluorescence of the 96-wells containing the three biological and three technical replicates. In parallel we put the pProv strain in normal LB media and measured the absorbance with a spectrophotometer every half an hour approximately to have the growth curve of E.coli.
For the electric setup, we linked the water sensor to the Arduino then to the computer. We put the water sensor in tubes which contained the LB with different salt concentrations and observed the values on the computer.
You can see a resumé of all the manipulations we did here!
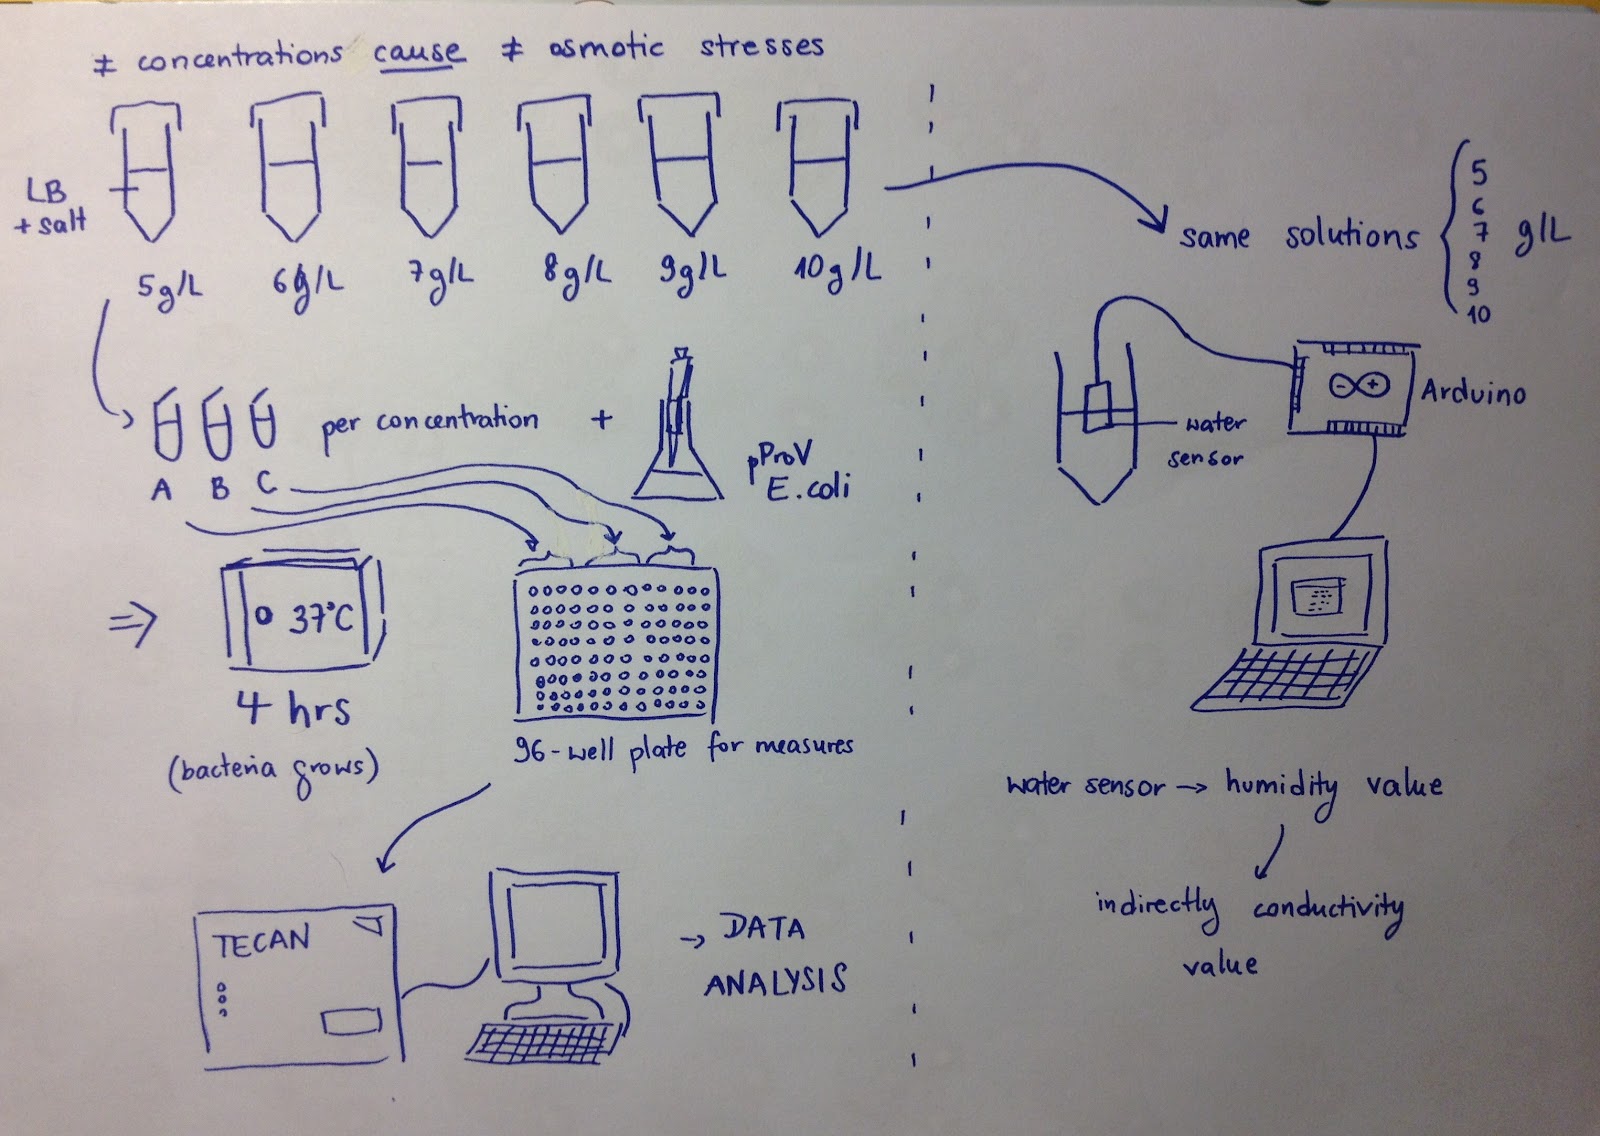
Experimental protocol for both biological and electronic sensors
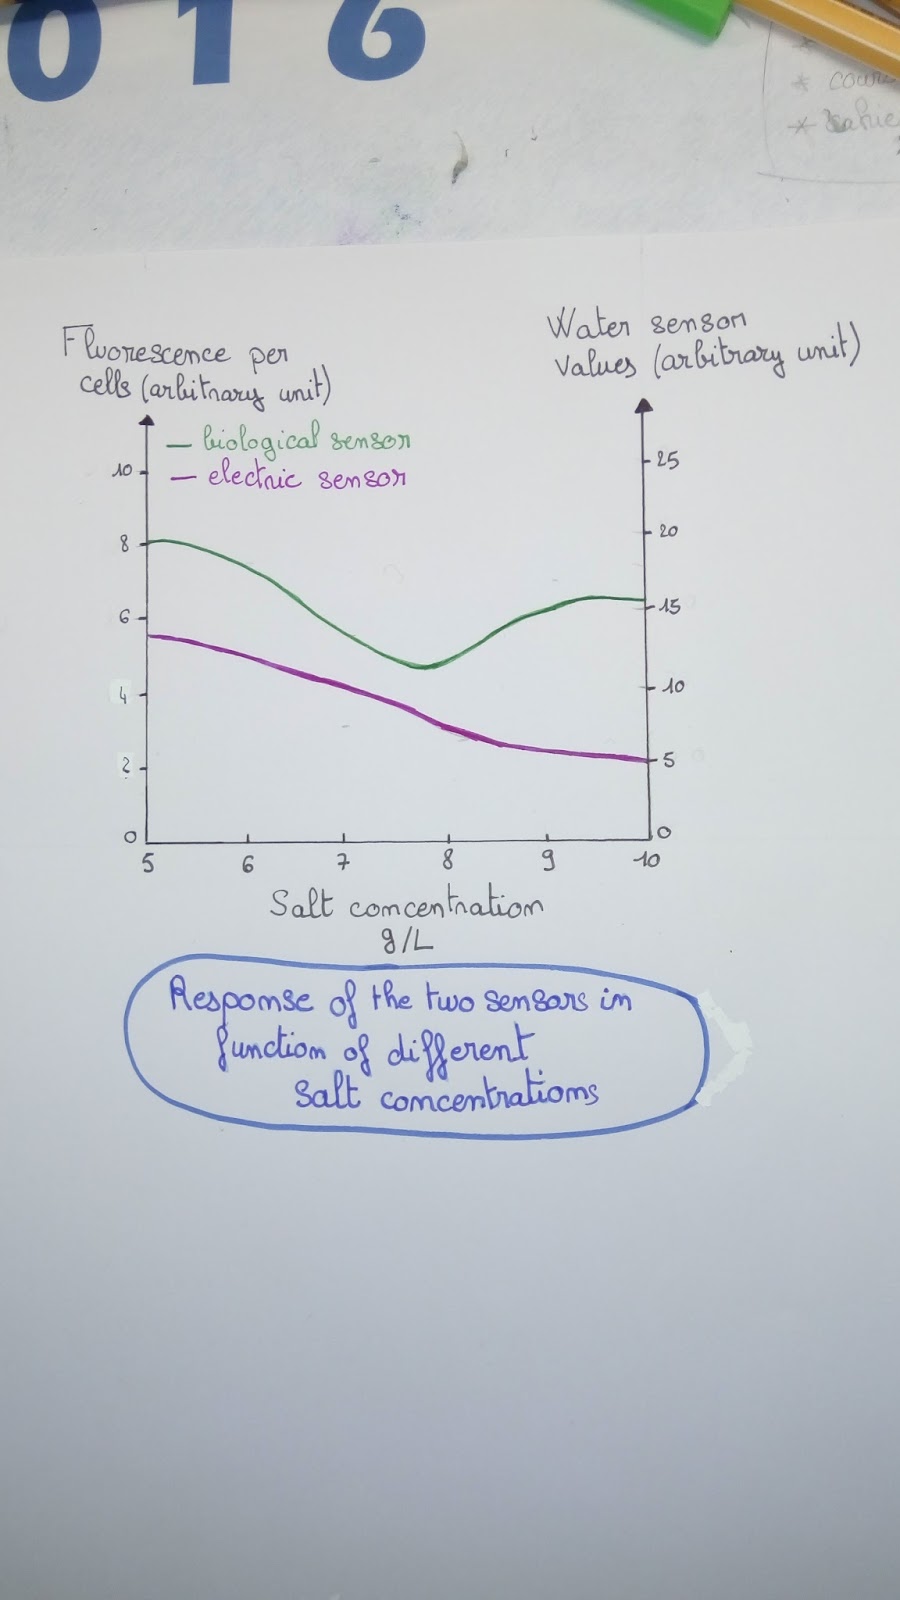
fig2: Response of both sensors
The graph shows the fluorescence per cell and the electrical sensor’s values (arbitrary unit for both) in function of the salt concentration (g/L), the green colour is used for the biological sensor (E.coli) and the purple for the electric sensor (water sensor). We can see that the fluorescence decreases from the salt concentration of 5g/L to the 8g/L and after increases again but the value at 10g/L is lower than 5g/L. For the electric sensor, we observe that values always decrease when the salt concentration increases. Nevertheless when the concentration of salt is too high, the sensor loses precision. It means that the sensor gives us values do not vary.
From careful analysis of our data, we find our water sensor more precise than pProV E.coli in detecting NaCl concentration in the LB media. The general tendency measured by our water sensor is a linear decrease. We were not able to understand the phenomenon that made the E.coli activity decrease and then increase. More replicates need to be done to verify this behavior. However, it’s important to notice that our two sensors give relative values and cannot give to absolute value of salt concentration. According to literature on the topic, the optimal NaCl concentration for pProv gene expression is about 3 g.L⁻¹; though usual LB media like the one we used has an NaCl concentration of 5 g.L⁻¹. If we had more time we could have made our own LB media. It could also be an interesting thing to analyse the E.coli activity with a more excessive salt concentration. And if you want to know more about phenomenon, here is another article to understand the role of PBS.
Project by Juliette Delahaye, Gaspard Baudrin, Yulian Dobrev and Clara Haas.
Project by Juliette Delahaye, Gaspard Baudrin, Yulian Dobrev and Clara Haas.
No comments:
Post a Comment