February 2, 2017

Fly traps vs. Piezo sensor : how fast are they?


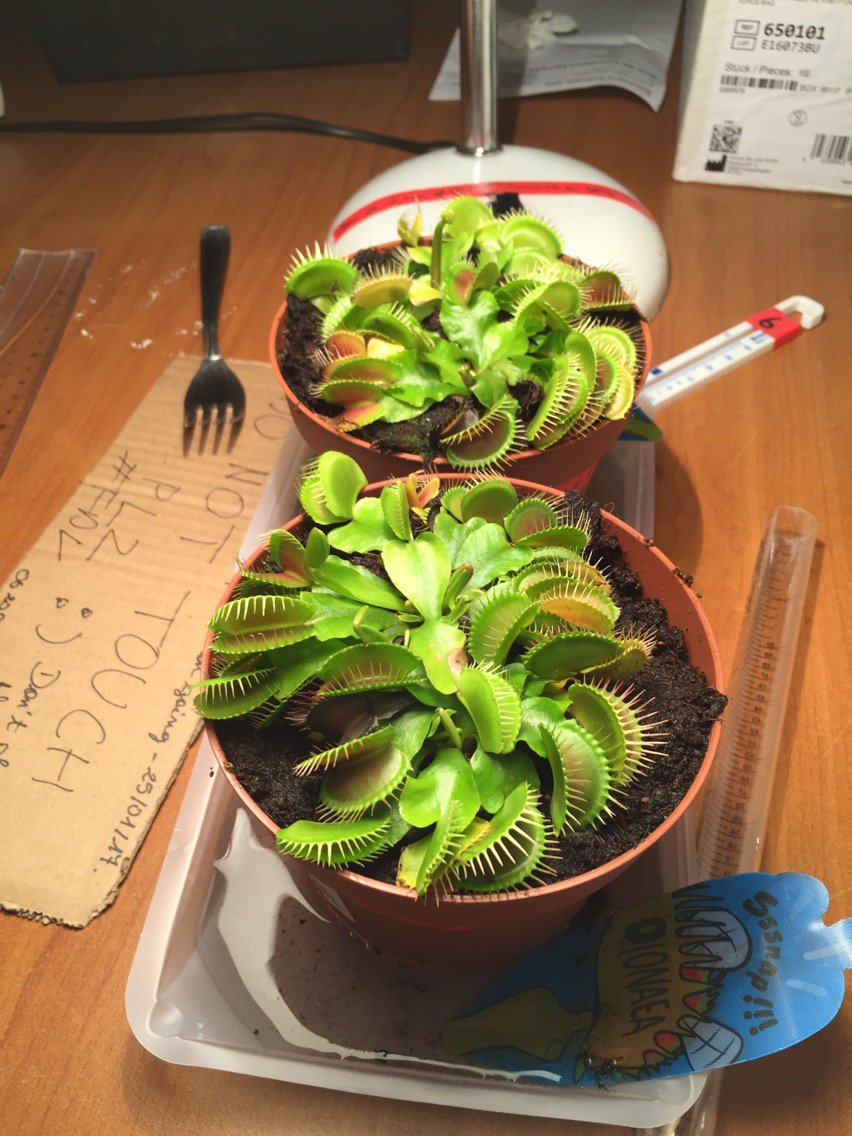
The Venus fly trap, known in the scientific community as Dionaea muscipula is one of the few plants in nature that is capable of rapid movement, along with Mimosa pudica. The plant possesses traps that are triggered when the hairs lining their inside are bent or touched. Within seconds, a wandering insect will be unable to escape and will be digested over the next ten days before the traps open again. This feature allows Dionaea to survive in poorly nutritious soils in the swamps of North and South Carolina, in the United States. Dionaea is a type of carnivorous plant that is easy to buy and cultivate, making them a prime choice for scientific study.Considering its ability to act in the blink of an eye, we wanted to know if this plant could react as fast as an electric sensor. We tried using an FSR sensor, but realized it was not sensitive enough to feel the force caused by the weight of a fly (between 0.1 and 0.3 grams), so we decided to use a Piezo element with Arduino. We prepared our newly purchased Dionaea under a bright lamp in a dark room and placed them in a dish containing osmotic water. We watered them regularly except over the weekend when the lab was not accessible. We also made sure the plants lived in an environment that was between 25 and 30°C in order to keep them from going into vernalisation, which is like hibernation but for plants (Picture 1).
Picture 1
The Venus Fly Trap we used
in our experiment.
Picture by Lina V.
We designed an experiment that consisted of dropping fake flies (made of plastic), shaped like small rugby balls, that possessed different weights onto the Piezo or the Fly trap while filming. We also recorded Piezo data from the Arduino port using a Python code and saved them in an electronic file. We 3D printed the same plastic flies at different densities to vary weight but not size and used a clear plastic tube to assure ourselves that we dropped the flies from the same distance every time. We used three different weights to simulate our flies: 0.14, 0.19, and 0.22 grams. In addition we planned three replicas of each weight and repeated the experiment with each fly 3 times (Picture 2 & 3).
Picture 3
Our Piezo Element setup
connected to Arduino and
a computer.
Picture by Elena C.


lbb_l6.gif
Picture 2
Our Plant experiment
Picture by Lina V.
We then viewed all footage frame by frame to determine the time it took for a trap to close after being fed and for a sensor to record the touch of the fly and calculated the average reaction time using all this data for both the Dionaea and the Piezo element.It took us a long time to collect enough data from the plants for us to present any results because every time a trap closes, it takes about 12 hours for it to open again. This meant we could only repeat the experiment once a day in our schedule. When we finally collected enough data to plot it, we noticed that the graphs obtained from the Piezo sensor and the Venus flytrap were similar in that the response time hardly varied when the fake fly became heavier, but the time scales on each graph were very different : It usually took about a second for the plant to react to a stimulus and approximately 50ms for the Piezo sensor. We applied some statistical tests to our data and found that no conclusions could be confidently drawn (Figure 1).
Figure 1 : Average response time of the Piezo sensor
and the Venus Flytrap when facing a stimuli
In the end it was clear that the Piezo element reacted much faster than the Venus Flytrap, but that the weights we used did not have any clear effect on its response time on either of our subjects. Perhaps weight has no influence, or we would have had to use much heavier or much lighter flies than the ones we studied.For more informations : Here is an article about the speed and mechanisms of Dionaea traps. If you want a quick introduction on how the Venus Flytrap closes, take a look at this video or, if you want to know more about Venus Flytrap take a look at this 9 facts video.If you want to know more about our protocol, data collected or coding elements, you can find it on our GitHub page. You can also find all the tweet we posted to inform people about our daily adventure in this storify :) © Elena CALAMAND, Daniel LOEB, Lina VIGNERON

Archaea & ohmmeter

Franck Porteous @FranckPrts
Julien Pichon @Ju_Pichon
Julie Le Bot  @FdvJulie

Halobacterium salinarum and osmotic pressure.
C29FrkKXUAM77JN.jpg:large.jpeg 
Hello everyone,
we are “Bacteriano”, and we are fascinated by little organisms called Halobacterium salinarum.  This specie of Archaea lives in very salty environment and it is this parameter that we want to study. Variation of environment salinity is a criteria of osmotic pressure. And to quantify the variation of salt in a media, and so variations of osmotic pressure, conductivity is a good tool.
We dream about a world where H. salinarum can give us the conductivity of a media. Maybe, we will show that this organism is more precise than a electronic sensor like a ohmmeter. So to sum up, is a biological sensor as an Archaea could give more precise information about a media than a electronic sensor ?

What is osmotic pressure?

osmoticpressure.jpg
Osmosis is a physical principle that occurs in a liquid at two different concentrations. To understand it, let say we have two media with two different concentrations of ions separate by a semi-permeable membrane.
The water can pass through the membrane but not the ions.
Due to Brownian movement, water diffuses towards the highest concentration of ions compartment, until both compartments have the same electrical charge.
If cells are in a water with not enough or too much ions, they lose or win water and die.
However, there is a mechanism called osmotic pressure that allows cells to survive. It prevents the water to move in or out cells.
Halobacterium sounds like bacterium

76318-top_foto2-uxncq.jpg
No! Halobacterium is an Archaea! It is an extremophile; this category of organism lives in, as it sounds, “extreme” environments, (high or low temperature, acidic or basic water... ). H.salinarum live in salted water like the Dead See.
Their characteristics are very
interessant to experiment conductivity. We can work with more salted media than other microorganism, so compare more higher conductivity.

However, the growth rate of H.salinarum (time until next generation of cell) depends of the osmotic pressure. So we can observe the size of a colony to know the concentration in ions, so the conductivity!
We decide to test different environment, in a range of salt to let our Archaea to grow, and in the same time to record its conductivity with an ohmmeter.

The DIY ohmeter (arduino)arduinoo.jpg
We have our biosensor! Miss the electronic sensor now
To measure the conductivity, we use an Arduino device that we build ourselves.
So we build this wonderful ohmmeter with an Arduino and threads.
The value of conductivity is given on the computer.
We will use it to measure the conductivity of LB media (where H.salinarum lives) with 6 different concentration of salt.


ohmeter.png
To test if our device records a coherent value, we measure the conductivity on our media with an ohmmeter ( a no DIY one!).
Our DIY ohmmeter seems to saturate faster than the other one.
However, the more salty the more conductive.


The growth of H.salinarum
To measure the growth of H.salinarum, we use a spectrophotometer Tecan Infinity: a spectrophotometer measures the optical density. And, this optical density is in direct relation with the number of H.salinarum.
Indeed, with the results given by the spectrophotometer we have a precise monitoring of Archaea evolution during 24 hours. We incubate our Archaea at 42°C, their ideal temperature, in 6 different concentrations.According to literature, 4.3M (approximatively 250g per liter !) is their ideal concentration to grow.  
To be able to read the growth rate, we plot every optical density per concentration (given by the spectrophotometer), and with R (a programming language) we graph the linear regression. The coefficient of linear regression gives us the actual growth rate per concentration. On the graph below, we observe the six concentrations and the linear regression for each one of them.
As you can see on the y scale, the optical density (ABS) is near 0 for every concentration. Indeed, Archaea are supposed to make a colony on 7 days, and we only observe them during 24 hour.
According these results, the concentration that is ideal for Archaea development is 3.9M. We can also notice that, in this experiment,  5.1M concentration slows Archaea growth.

H.salinarum versus DIY ohmeter : Conclusion

To conclude, in both biological and electronic sensor, salt, so osmotic pressure has an influence: for the Arduino, the conductivity is higher and for Archaea, the growth rate is not the same. However, there is a linear correlation between salt concentration and conductivity, but there is not with Archaea growth.
So if you want to test salt concentration of medium, and know if it is near 4M, use Archaea! If they grow, here you go. But if you want a more precise measure, we advise you to take a ohmmeter :)

If you want to know more, take a look on our PowerPoint presentation, for more graphs and schema of our experiment.
And if you want to see more precisely our data, Arduino and R codes, find all our resources on line, on GitHub.
And finally, during all our project, we twitted everyday (@Bacteruino) and we made  little storify to sum up this intensive week.


Sources :

  • Leuko, Stefan, Mark J. Raftery, Brendan P. Burns, Malcolm R. Walter, et Brett A. Neilan. « Global Protein-Level Responses of Halobacterium Salinarum NRC-1 to Prolonged Changes in External Sodium Chloride Concentrations ». Journal of Proteome Research 8, no 5 (mai 2009): 2218‑25. doi:10.1021/pr800663c.
  • « Halohandbook_2008_v7 - Halohandbook_2008_v7.pdf ». Consulté le 25 janvier 2017. http://www.haloarchaea.com/resources/halohandbook/Halohandbook_2008_v7.pdf.
  • Kish, Adrienne, Patrick L. Griffin, Karyn L. Rogers, Marilyn L. Fogel, Russell J. Hemley, et Andrew Steele. « High-Pressure Tolerance in Halobacterium Salinarum NRC-1 and Other Non-Piezophilic Prokaryotes ». Extremophiles: Life Under Extreme Conditions 16, no 2 (mars 2012): 355‑61. doi:10.1007/s00792-011-0418-8.

Simulated Gravity : How do electronic and biological sensors perceive it?

 
Simulated Gravity : How do electronic and biological sensors perceive it?


Emelyne Gaudichau, Louise Dagher, François SACQUIN


One variable that has been constant throughout the history of life on Earth, whatever the environment or the climate, is gravity. This has led some organisms to start using this unending force as an evolutionary advantage. That is the case for plants who developed “gravitropism”, the ability to use gravity as a “guide” for their roots to grow deeper in the ground and their stem towards sunlight.


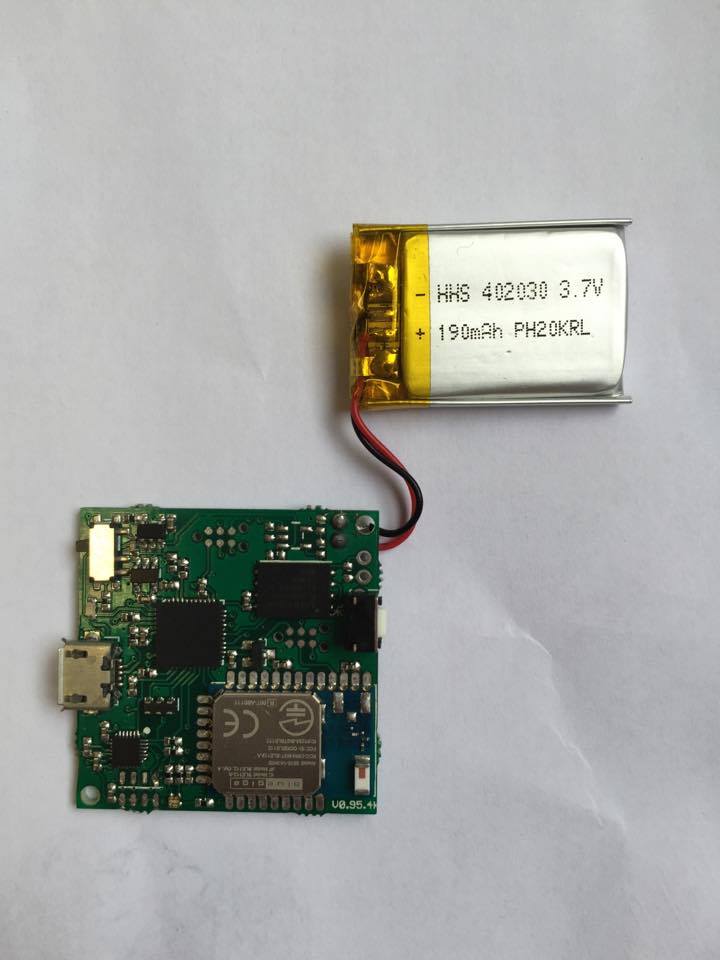
This led us to imagine an experiment to discover the correlation between the gravitational intensity and plant development. Then, if such link could be proven, we could compare the results of our biological “sensor” to data obtained via an electronic sensor. For this task, we chose to use a Movuino : a motion sensing board featuring an accelerometer, a battery and a wifi module. For the plant, we found that lentil seeds were the best and simplest choice to put plants in another gravity.


Through our bibliographical search, we found out that Nasa had already done a lot of research on plant development in zero gravity. However, very little had been done on the other side of the spectrum : hyper-gravity. Our next goal was to find an durable way to apply a simulated gravity to plant seeds for many days without interruption. This would allow us to exercise pressure on a seed during the germination process and compare it.

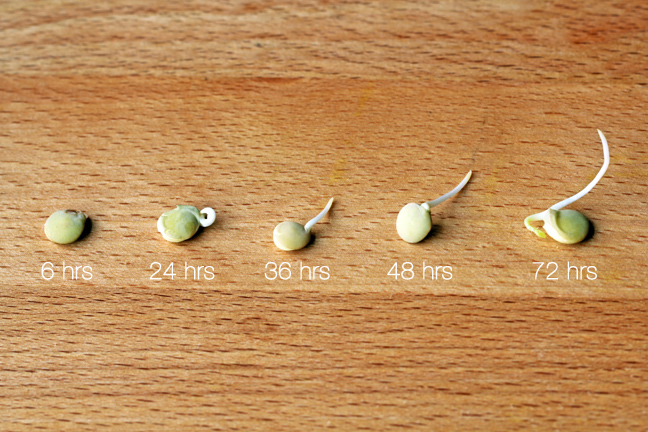
Picture Description : Germination development of a lentil seed. This shows how germination is moreover a quick process that suits our experiment.


And check out this cool timelapse of lentil seeds germinating in cotton. The fact we only need cotton as support for the seeds helped a lot for this experiment.


Experimental Set-up
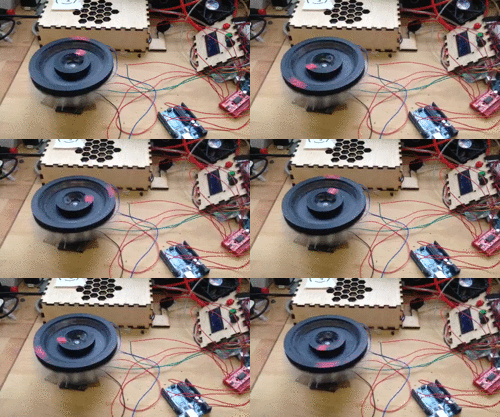
To build the centrifuge, we first designed the overall plate using Fusion360 to have 2 concentric rings of 6 and 20 holes. We glued it to a nema 17 stepper motor and hooked up that motor to an arduino and a computer to control its speed. To ensure a certain level of security, we used the webcam of the computer to check on the experiment as often as possible.
bloggif_5890ac5d586fd.gif
Sensor Experiment
Electronic Sensor: We tapped the Movuino on the rings, waited for the centrifuge to reach its intended speed and set it to record 200 acceleration measures over 10 seconds. This was repeated 5 times for each ring and we only analyzed horizontal acceleration.
Biological Sensor: The lentil seeds were pre-germinated for 2 days before the launch of the experiment. We chose the most green seeds and put them in the tubes with cotton and 50 microlitres of water. We had 21 control seeds that stood in the exact same conditions but without rotation. They rotated for 84 hours, stopping every 24 hours for 5 minutes to be watered. After that, they were all weighted and we measured the length of their stem and roots.


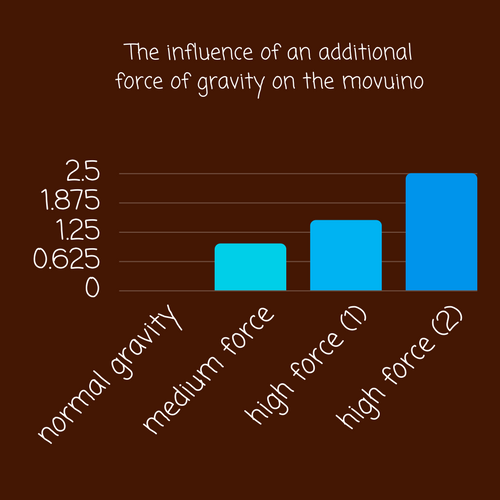
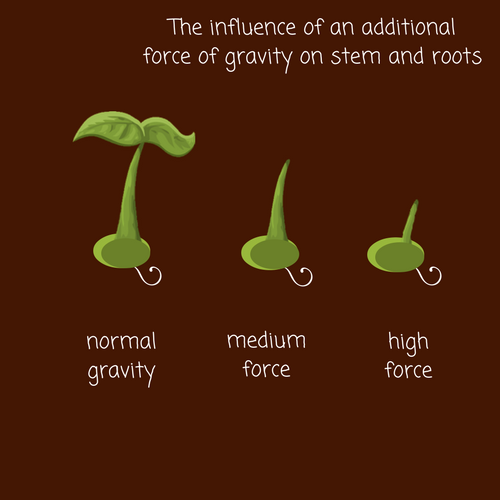
The following images show our two types of results: the force applied on the center and on the border of the plate for the electronic sensor and the stage of the lentils for the biological sensor.
3.png


The first figure shows that the force applied on the border is higher than the force applied on the center. The values calculated are in Newton (a force unit) and turn around the magnitude 10-5. We can see two different values for the force applied on the border (high force (1) and (2)), we think that the Movuino was not at the same place when we repeated the measures. However, the two values are already higher than the center value (medium force). Moreover, for a normal gravity, the Movuino detects nothing, which means detecting no new force by being fixed.


2.png


The second figure shows the size of the root and the stem of the lentils. There are three different stages of the lentils for the three conditions : the lentils on the center of the plate, one the border, and the lentils in normal condition. In our results, we observed to notice an influence of an higher gravity in the development of the stem and not for the roots.


In a nutshell, thanks to our results and literature, we can suggest that hyper-gravity could have an influence on the stem development for plants. Furthermore, by testing the Movuino on this characteristic, we can affirm that it is precise but not accurate based on the theoretical forces calculated. Finally, in a critical view, there are many noises and bias that could have interfered with the experiments, as usual in a scientific project!


But, if this amazing student project made you want to know more, you can consult our Twitter @TerraForceFDV our storify and our GitHub!

Blog disclaimer

The content created by the Learning thru research Student Bloggers and those providing comments are theirs alone, and do not reflect the opinions of Centre de recherche interdisciplinaire, University Paris Descartes or any employee thereof. The authors of posts and comments are responsible for the accuracy of any of the information supplied on this blog, as well as for any content copyright issues.