
 |
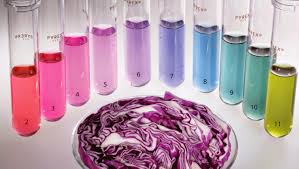
| pH color indication range of red cabbage |
Hello dear followers ! Thank you for always being so faithful to the research projects of the team F5 ! Today let us introduce you to the design of our exciting new proje ct. Indeed we received funding to open a chemical cocktail bar !!! Therefore our task was to design and experiment about the drinks that could be served.
Our first challenge was to know if it was possible to have solutions that would change color in function of temperature. As we know, the color of a solution can vary depending of the pH through a color indicator. Thus we wanted to see if it was possible to make the pH of a solution change in function of the temperature.
But first, let’s all be clear about what pH and color indicators are and their interaction with each other.
The pH is a scale that goes from 1 to 14 indicating the acidity or alkalinity of a solution, 1 being the most acid, 7 neutral and 14 the most alkaline. pH is defined as the concentration of H30+ (hydronium ions) in the solution (pH= -log[H3O⁺]) and so, each unit change represents a tenfold change in the concentration of the hydrogen-ion concentration.
Color indicators are weak acids that indicates the pH of a solution by color change. They are changing their shape through molecular interaction with H3O+ directly impacting on the color of the solution.
There are lots of natural different color indicators, as red cabbage or hortensias.
To answer our challenge, we first determined a set of cocktail that we would test (including vinegar, water, ethanol, grapefruit juice and unicorn blood, just kidding~) and then we measured the evolution of pH in function of temperatures with a pH meter. We proceed to the smartest protocol that we could think off : we immerged each solution in different water-baths at different temperatures and then we measured their pH. Therefore we selected the solutions with the biggest variation of pH to test a color indication with red cabbage juice.

What do you mean you’re “not entertained” ? This graph is awesome ! On this graph we can actually compare the pH changes due to temperature, for all our solutions !!! Indeed with the data we collected with the pH meter we were able to calculate the change in pH between 5°C and 25°C and between 25°C and 40°C for each of our solutions. Then we calculated the average of the two previous results and applied absolute value to it. So we had calculated the multiplying factor of pH changes given temperature changes, for each of our solution. Therefore we could visualize our data with a linear relationship between pH value and temperature. On our graph we can see that sodium bicarbonate has the most steepest line, experiencing the highest variations in pH due to temperature changes, and vinegar has the most flat line, experiencing the lowest variations in pH due to temperature changes.
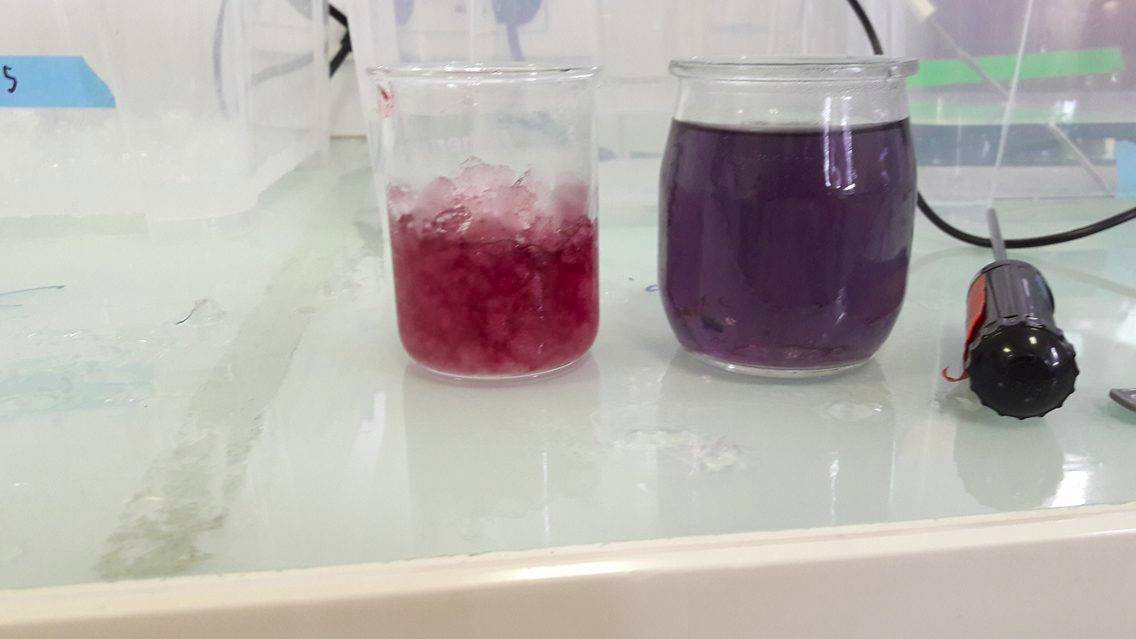 |
| Change in color, and so pH, in our solution (cold left and hot right) |
Thanks to our wonderful experiment, we can now present you the composition our marvelous cocktails: the sodium bicarbonate “parfait”, the washing powder “café” and finally, the salted water “juice”. All of our beverage are served with their tasteful red-cabbage-juice ice cube and at any temperature you want ! If you want to reproduce this at home, try to have a well calibrated pH-meter and a large range of water bathing temperature.
If you want to know more ...
- Or promotional video will be online soon !
- About pH : https://en.wikipedia.org/wiki/PH
- About color indicators : https://en.wikipedia.org/wiki/PH_indicator
- About how to use a pH meter correctly: https://www.youtube.com/watch?v=vwY-xWMam7o
- About maths behind the measurment of pH with a pHmeter: https://chem.libretexts.org/Core/Physical_and_Theoretical_Chemistry/Acids_and_Bases/Acids_and_Bases_in_Aqueous_Solutions/The_pH_Scale/Temperature_Dependence_of_the_pH_of_pure_Water
- A scientific article about the influence of temperature on pH: https://reagecon.com/pdf/technicalpapers/Effects_of_Temperature_on_pH_v4-_TSP-01-2.pdf
- An interesing blog post about the influence of temperature on pH: https://www.quora.com/How-does-temperature-affect-the-pH-of-liquids
- The detailed protocol we used in our experiments: https://docs.google.com/document/d/1LSw2fPz0HYHn7Rp0svFvTyKRE9EP1skVe0h8ia8pY04/edit
- The presentation of our project for a general public : https://docs.google.com/presentation/d/1luXLQfkcw7lxQRCfYME0ORoh-0-zTgPcSuR1073knps/edit?ts=58f0d05f#slide=id.pHortense Carlevan, Benoit Van Der Zyppe, Camille Duquesne02/05/17
No comments:
Post a Comment