
Influence of temperature on Saccharomyces cerevisiae fermentation speed
We are finally reunited, the three of us to develop our diabolical project… Our aim? Becoming rich by making ... BREAD ! But we want to process really quickly to sell our bread because this money will allow us to go to … IBIZA this summer !
So now the question is: How can we make our bread dough rise as fast as possible?
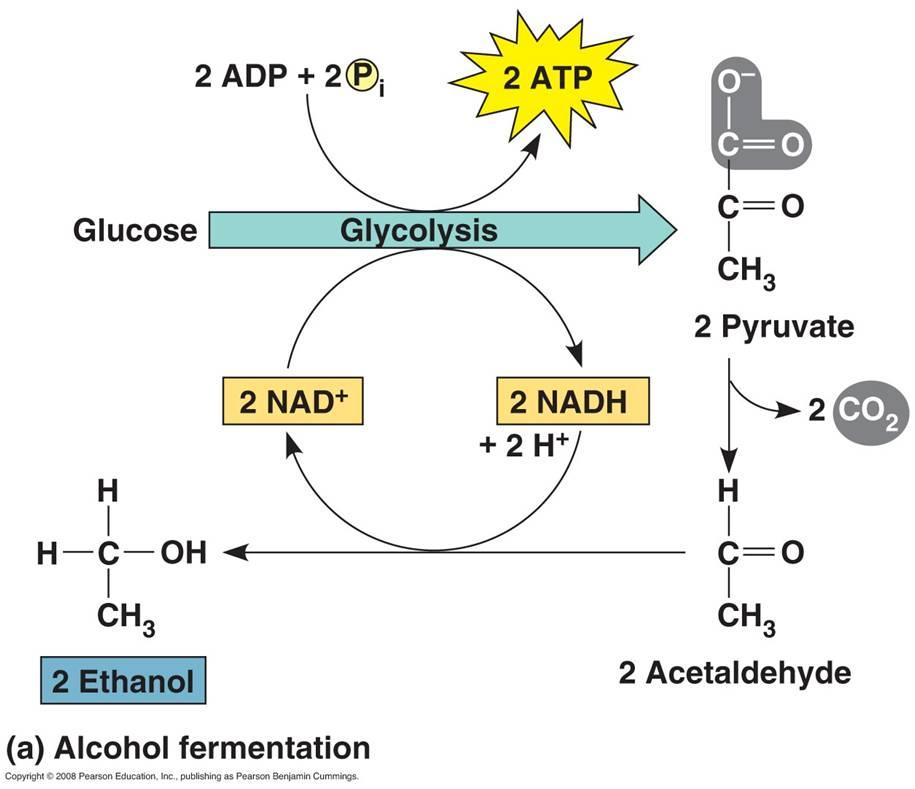
It is known that BREAD dough rises thanks to the process of yeast fermentation. Fermentation is a metabolic process which may occur without oxygen. In dough, yeasts convert a sugar (a carbohydrate for the more scientist) into alcohol and CO2. There is an equation for this process, for those who aren’t just interested in food :
C6H12O6 → 2 C2H5OH + 2 CO2`
We can see that one molecule of sugar is turned into two alcohol molecules and two carbon dioxide molecules. There is the explanation of the entire process :
http://test.classconnection.s3.amazonaws.com/529/flashcards/475529/jpg/lactic-acid-fermentation.jpg
But how to speed up this reaction? We decided to test the influence of the temperature on fermentation, to figure out what is the optimal one.
Experiment :
The only product of the reaction of fermentation that we can observe was the CO2 (gas). So we decided to measure the speed of the release of CO2 in order to estimate the reaction’s speed. We wanted to compare this speed at different temperatures.
Protocol :
-
Add 15g of glucose in 300 mL of water in a plastic bottle
-
Drill each bottle cap with a screw to introduce the tube (containing colorant) in the bottle
-
Incubate all 4 bottles at 25, 27, 35, 37, 40°C for 10 minutes to bring the solution at correct temperature.
-
Add 15g of bakery yeast in each bottle
-
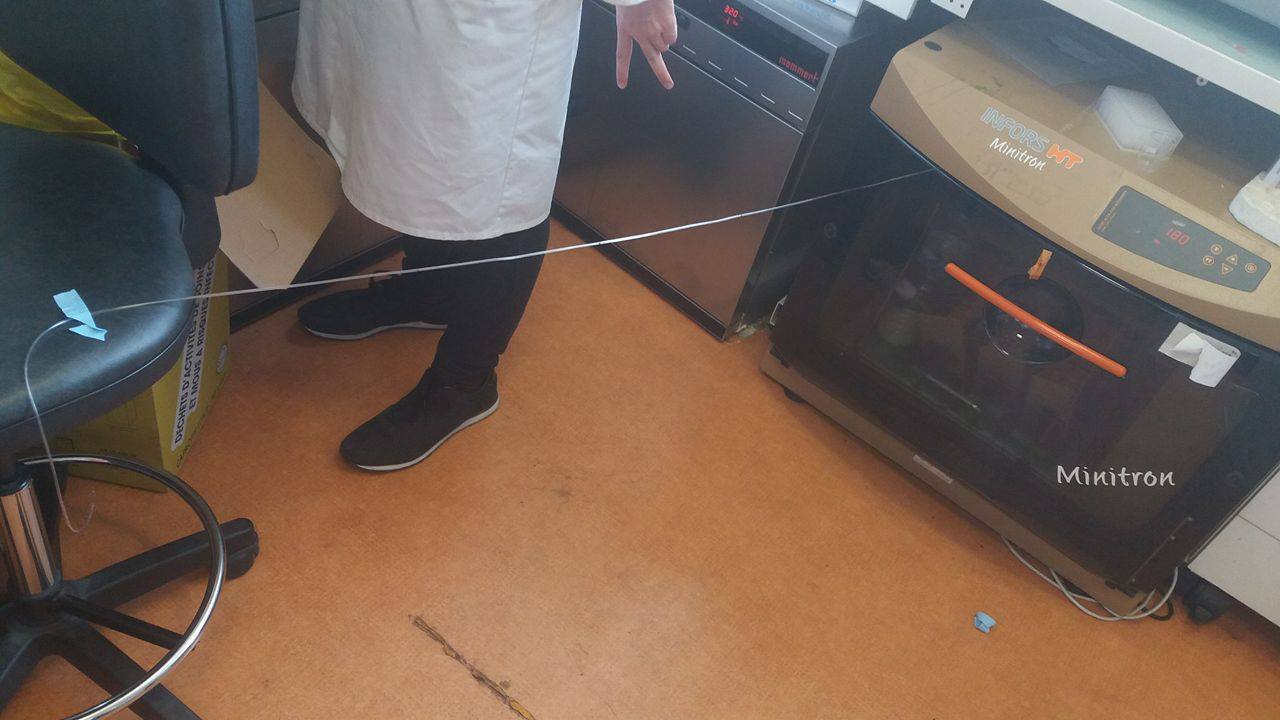
The capillary, going out of the incubator, is fixed horizontally using tape
-
Make 3 marks at 10 cm of distance of each other.
-
Measure the time the colorant takes to travel the 10 cm marked
→ Repeat this experiment as many times as possible to have a better approximation, to calculate the average speed of the colorant that is relevant to the reaction speed.
Set up for 30°C

Set up for 25°C

Set up for 35 and 37°C
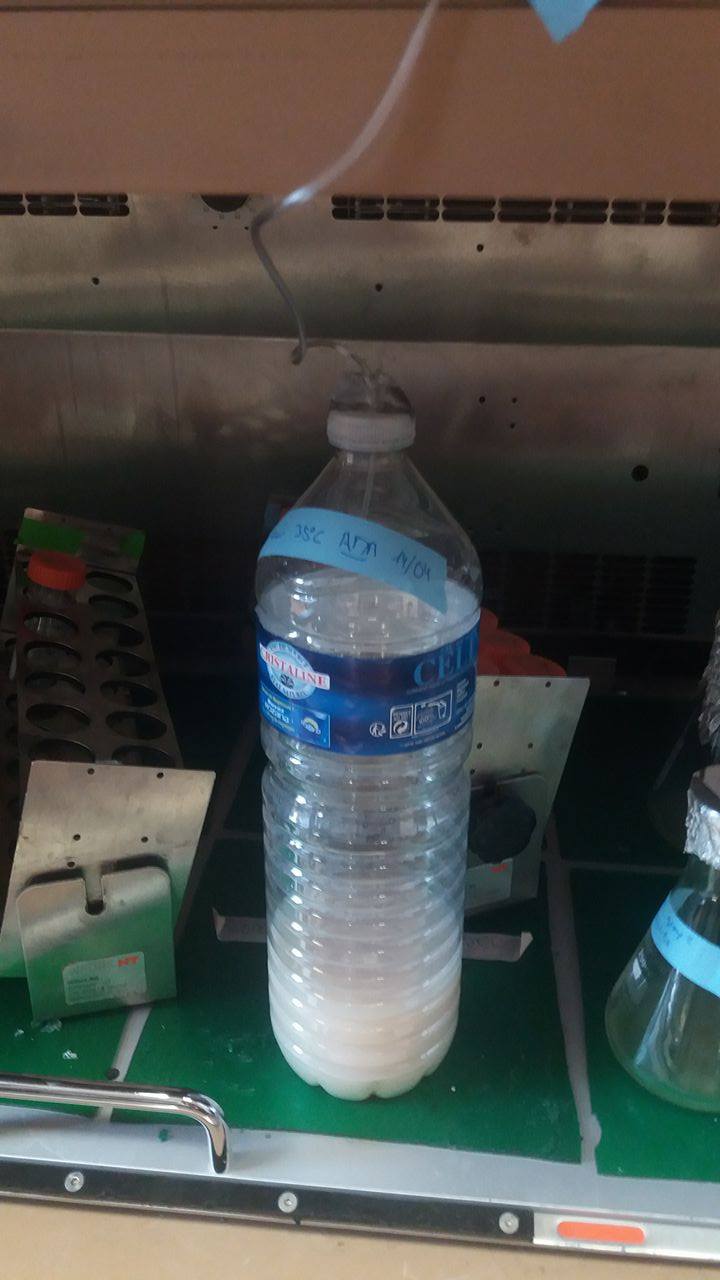
Bottle in an incubator
Results :
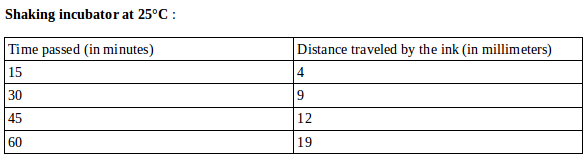 The ink moved extremely slowly through the tube. Over a total time of 1h40 minutes, it traveled for 19mm, over 1h, then almost stopped.
Average speed (really low) =0,000556cm/s ~19,8mm/h.
The ink moved extremely slowly through the tube. Over a total time of 1h40 minutes, it traveled for 19mm, over 1h, then almost stopped.
Average speed (really low) =0,000556cm/s ~19,8mm/h.
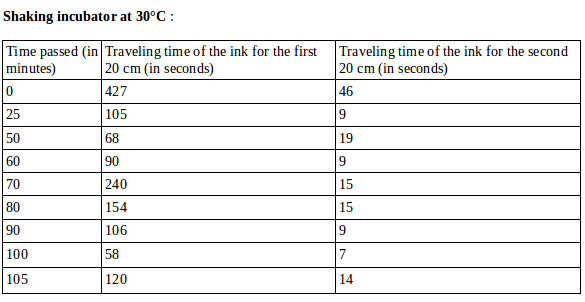
The first value (at time zero) shows that the reaction doesn’t occur instantly but takes some time.
The ink moves slower over the first 20cm and faster over the second 20cm.
Average speed for the 2nd 20cm =1,7cm/s.

For the incubators at 30, 35 and 37°C, we observed that the ink starts by moving slowly, then speeds up really fast at one point, then slows down a few seconds later, and continues to push the ink until the end of the tube.
Our hypothesis to explain this phenomenon is that CO2 accumulates in front of the ink, therefore the pressure builds up, to a point where CO2 diffuses through the ink, which speeds up. After, the pressure goes down, so does the speed of the ink.
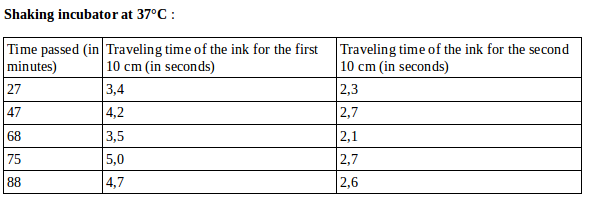
The measurements for 35 and 37°C were done on portions of the tube where the ink was going fast, so it doesn’t show accurately the speed of the ink.
For the fast-moving ink :
Average speed =2,28cm/s at 35°C
Average speed =2,48cm/s at 37°C
Conclusion :
http://test.classconnection.s3.amazonaws.com/529/flashcards/475529/jpg/lactic-acid-fermentation.jpg
But how to speed up this reaction? We decided to test the influence of the temperature on fermentation, to figure out what is the optimal one.
Add 15g of glucose in 300 mL of water in a plastic bottle
Drill each bottle cap with a screw to introduce the tube (containing colorant) in the bottle
Incubate all 4 bottles at 25, 27, 35, 37, 40°C for 10 minutes to bring the solution at correct temperature.
Add 15g of bakery yeast in each bottle
The capillary, going out of the incubator, is fixed horizontally using tape
Make 3 marks at 10 cm of distance of each other.
Measure the time the colorant takes to travel the 10 cm marked
|
| Set up for 30°C |
|
| Set up for 25°C |
|
| Set up for 35 and 37°C |
|
| Bottle in an incubator |
The first value (at time zero) shows that the reaction doesn’t occur instantly but takes some time.
We could conclude that the optimal temperature between 25, 30, 35, 37°C for bakery yeast fermentation is 37°C.
25°C is not enough for the fermentation to occur. Enzymes helping in yeast metabolism might not be functional at this temperature.
We put the bottle from the 25°C incubator into another one at 35°C, the reaction occurred and the colorant moved fast, so we’re sure that our set up had no problem.
Now we could ask ourselves if the pressure influence yeasts metabolism. We could repeat this experiment but changing the parameter studied : at a constant temperature, but at different pressure.
We could also compare different types of yeast, (with beer yeast) in order to show whether different type of yeast have different optimal conditions.
If you want to know more :
- Yeast (wikipedia) : https://en.wikipedia.org/wiki/Yeast
- Fermentation (wikipedia) : https://en.wikipedia.org/wiki/Fermentation
- Blog about baker yeast fermentation for the cooking of bread : http://www.snv.jussieu.fr/bmedia/blepain/3pain/pain2.htm
- Link to a video showing how the ink moves : https://drive.google.com/a/cri-paris.org/file/d/0Bydr3Agf3FV6bzhBWEViLWd5dEU/view?usp=sharing
Amandine Maire, Roxane Jannin and Mathieu Szotowski


