
Observations of Pseudomonas putida’s colonies overtime
In the field of the microbiology, there are many different and interesting microorganisms, just in our body we have more than 500 species of bacteria. I chose to work on one specific bacterium that live naturally in soil: Pseudomonas putida. This organism have many properties, for example, P. putida can live in pure caffeine and breaks down several polluants to make them biodegradable. P. putida have also interesting shape, the colonies are not round and regular as E. coli’s colonies but they have what seems to be unpredictable patterns of formation. After some research, I have noticed that the morphology and the formation of P. putida are not well referenced on the literature, last articles that I have found are from the 80’s. It’s interesting to have more knowledge about that to better understand the globality and the fonctionnement of this organism. So, in my experiment I was focused on the patterns of P. putida’s colonies development on a non-competitive environment and more specifically, the size of a colony at different times of growth.
First, I have started my experiment plating 30 plates, then I’ve put them in the incubator at 37°C. After 12h, 24h, 34h, 48h, 53h and 68h of incubation, I’ve took pictures of all my plates. To analyze my data, I’ve used ImageJ, a software to analyze pictures and measure the area of every colony in a non-competitive environment, that means in this case, colonies which are spaced by, at least, 2mm of an other colony.
 |
| After analyze of the picture. |
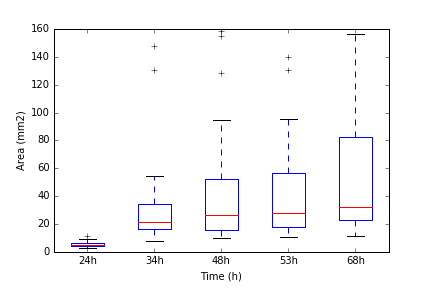
In my results, we can see that the area of colonies is increasing in time. To go further, we can observe that the main moment of growth is between 24h and 34h of incubation. After 24h the median of the area of colonies is 5.05mm² and after 34h the median is at 21.85mm², so there is a factor of 4. After this moment, the growth of most of the colonies is slower, the area is 26.4mm² after 48h, 27.9mm² after 53h, 32.1mm² after 68h.
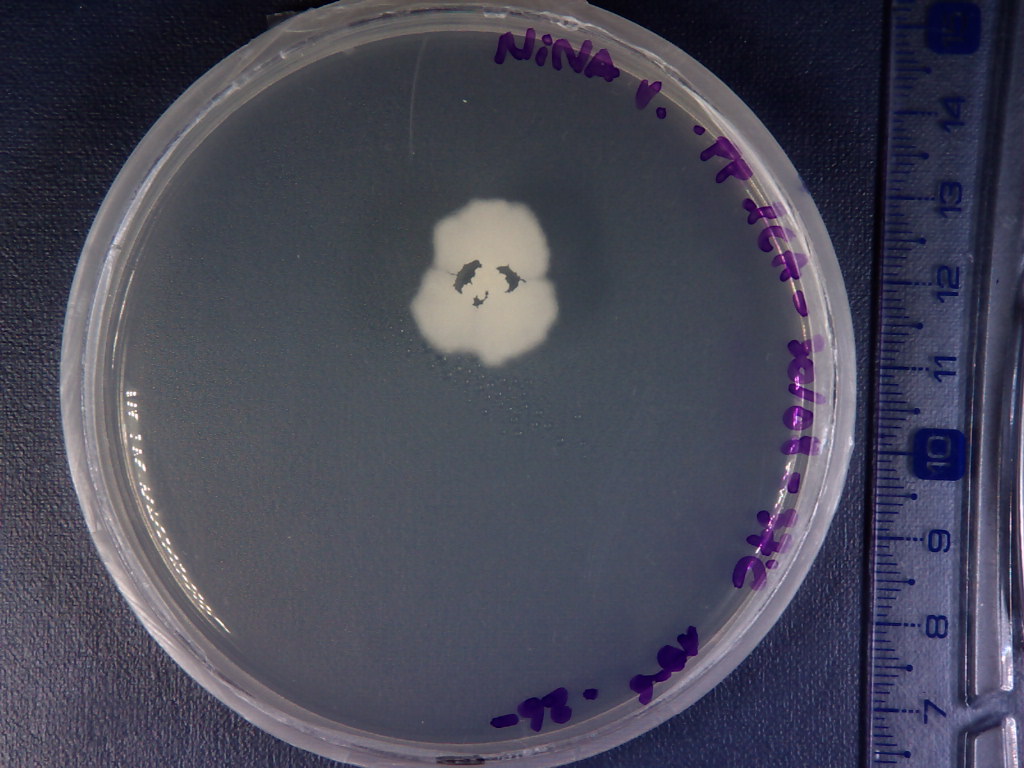
Another observation about the development of the P. putida’s colonies, it’s the formation of a darker circle around the place of the original cell that had created the colony. The apparition of dark centers is visible at the same time in almost every colonies of a plate but it’s not homogenous between plates.

A hypothesis to explain the apparition of these dark centers is that the cells in that region are older and so are dying first, that makes a region more opaque than the rest of the colony.
One next experiment could be take a sample of the dark center when it becomes visible and one sample of the edge of the colony to compare with microscope the state of the cells. These observations could confirm or reject my present hypothesis. At the same time, pictures could be taken with a small interval of time to the objective of see the time that it takes to dark centers to appear in order to have a better understanding of its formation.
If you want to know more…
Shapiro, J. A. “Scanning electron microscope study of Pseudomonas putida colonies.” Journal of Bacteriology 164.3 (1985) : 1171-1181.
http://web.mst.edu/~microbio/bio221_2007/P_putida.htm
http://en.citizendium.org/wiki/Pseudomonas_putida
No comments:
Post a Comment